Chapter Contents
Chapter Contents
Previous
Previous
Next
Next
The AUTOREG Procedure

Example 8.4: Missing Values

In this example, a pure autoregressive error model with no regressors is used to generate 50 values of a time series. Approximately fifteen percent of the values are randomly chosen and set to missing. The following statements generate the data.


   title  'Simulated Time Series with Roots:';
   title2 ' (X-1.25)(X**4-1.25)';
   title3 'With 15% Missing Values';
   data ar;
      do i=1 to 550;
         e = rannor(12345);
         n = sum( e, .8*n1, .8*n4, -.64*n5 ); /* ar process  */
         y = n;
         if ranuni(12345) > .85 then y = .;    /* 15% missing */
         n5=n4; n4=n3; n3=n2; n2=n1; n1=n;    /* set lags    */
         if i>500 then output;
         end;
   run;

The model is estimated using maximum likelihood, and the residuals are plotted with 99% confidence limits. The PARTIAL option prints the partial autocorrelations. The following statements fit the model:


   proc autoreg data=ar partial;
      model y = / nlag=(1 4 5) method=ml;
      output out=a predicted=p residual=r ucl=u lcl=l alphacli=.01;
   run;

The printed output produced by the AUTOREG procedure is shown in Output 8.4.1.

Output 8.4.1: Autocorrelation-Corrected Regression Results

Simulated Time Series with Roots:
(X-1.25)(X**4-1.25)
With 15% Missing Values

The AUTOREG Procedure

Dependent Variable y

Ordinary Least Squares Estimates
SSE 182.972379 DFE 40
MSE 4.57431 Root MSE 2.13876
SBC 181.39282 AIC 179.679248
Regress R-Square 0.0000 Total R-Square 0.0000
Durbin-Watson 1.3962    

Variable DF Estimate Standard Error t Value Approx
Pr > |t|
Intercept 1 -2.2387 0.3340 -6.70 <.0001

Estimates of Autocorrelations
Lag Covariance Correlation
-1 9 8 7 6 5 4 3 2 1 0 1 2 3 4 5 6 7 8 9 1 
0 4.4627 1.000000
|                    |********************|
1 1.4241 0.319109
|                    |******              |
2 1.6505 0.369829
|                    |*******             |
3 0.6808 0.152551
|                    |***                 |
4 2.9167 0.653556
|                    |*************       |
5 -0.3816 -0.085519
|                  **|                    |

Partial Autocorrelations
1 0.319109
4 0.619288
5 -0.821179


The AUTOREG Procedure

Preliminary MSE 0.7609

Estimates of Autoregressive Parameters
Lag Coefficient Standard Error t Value
1 -0.733182 0.089966 -8.15
4 -0.803754 0.071849 -11.19
5 0.821179 0.093818 8.75

Expected Autocorrelations
Lag Autocorr
0 1.0000
1 0.4204
2 0.2480
3 0.3160
4 0.6903
5 0.0228

Algorithm converged.

Maximum Likelihood Estimates
SSE 48.4396756 DFE 37
MSE 1.30918 Root MSE 1.14419
SBC 146.879013 AIC 140.024725
Regress R-Square 0.0000 Total R-Square 0.7353
Durbin-Watson 2.9457    

Variable DF Estimate Standard Error t Value Approx
Pr > |t|
Intercept 1 -2.2370 0.5239 -4.27 0.0001
AR1 1 -0.6201 0.1129 -5.49 <.0001
AR4 1 -0.7237 0.0914 -7.92 <.0001
AR5 1 0.6550 0.1202 5.45 <.0001


The AUTOREG Procedure

Expected Autocorrelations
Lag Autocorr
0 1.0000
1 0.4204
2 0.2423
3 0.2958
4 0.6318
5 0.0411

Autoregressive parameters assumed given.
Variable DF Estimate Standard Error t Value Approx
Pr > |t|
Intercept 1 -2.2370 0.5225 -4.28 0.0001


The following statements plot the residuals and confidence limits:


   data reshape1;
      set a;
      miss = .;
      if r=. then do;
         miss = p;
         p = .;
         end;
   run;
   
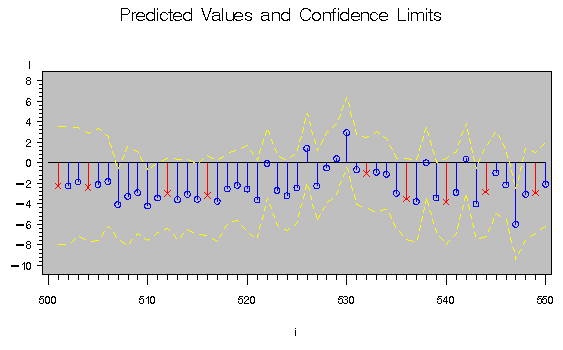
   title 'Predicted Values and Confidence Limits';
   proc gplot data=reshape1;
      plot l*i=1 miss*i=2 p*i=3 u*i=4 / overlay;
      symbol1  i=join v=none l=2;
      symbol2  i=needle v='X';
      symbol3  i=needle v=circle;
      symbol4  i=join v=none l=2;
   run;

The plot of the predicted values and the upper and lower confidence limits is shown in Output 8.4.2. Note that the confidence interval is wider at the beginning of the series (when there are no past noise values to use in the forecast equation) and after missing values where, again, there is an incomplete set of past residuals.

Output 8.4.2: Plot of Residuals and Confidence Interval
autex04d.gif (6403 bytes)

Chapter Contents
Chapter Contents
Previous
Previous
Next
Next
Top
Top

Copyright © 1999 by SAS Institute Inc., Cary, NC, USA. All rights reserved.