Chapter Contents
Previous
Next
|
Chapter Contents |
Previous |
Next |
| Multivariate Analyses |
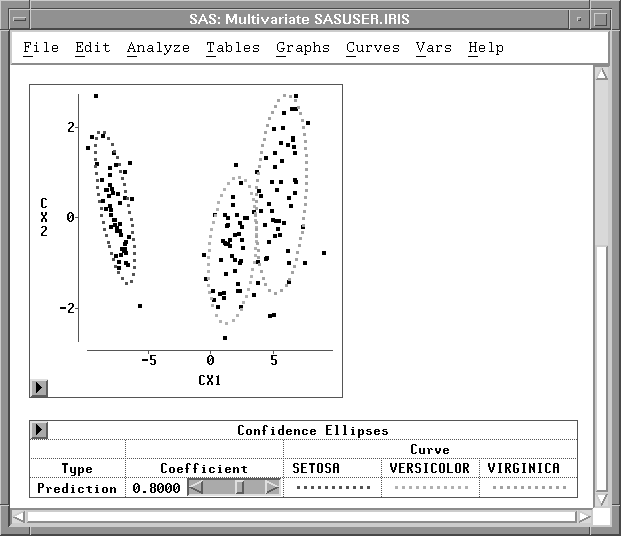
Figure 40.51 displays a scatter plot of the first two canonical components with class-specific 80% prediction confidence ellipses. The figure shows that the first canonical variable CX1 has most of the discriminntory power between the two canonical variables.
|
Chapter Contents |
Previous |
Next |
Top |
Copyright © 1999 by SAS Institute Inc., Cary, NC, USA. All rights reserved.