Chapter Contents
Previous
Next
|
Chapter Contents |
Previous |
Next |
| Exploring Data in Three Dimensions |
Using rotation you can obtain unique views into the data that can reveal structure not visible with static plots or not detectable with analytic methods. Follow these steps to explore the relationships among students' SAT verbal scores, SAT math scores, and college grade point averages.
| Open the GPA data set. |
| Choose Analyze:Rotating Plot ( Z Y X ). |
![[menu]](images/threq1.gif)
Figure 6.2: Creating a Rotating Plot
A rotating plot variables dialog appears, as shown in Figure 6.3. The ( Z Y X ) in the menu indicates that Z, Y, and X variables are required to create the rotating plot.
| Select GPA in the variables list at the left. Then click Z. |
This assigns the Z role to
the GPA variable. Using the same method, assign
SATM the Y role and SATV the
X role.
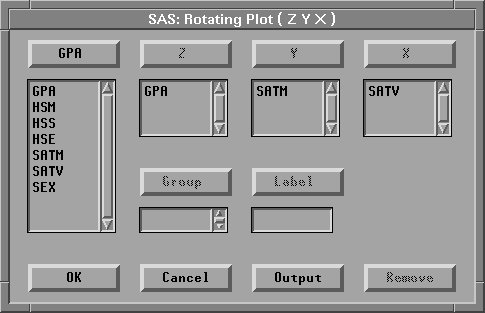
| Click OK to create a rotating plot. |
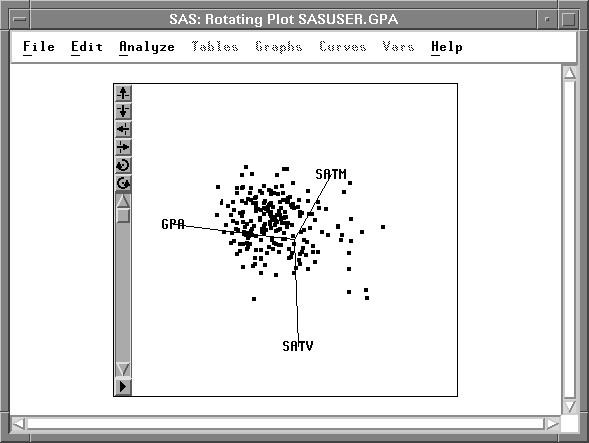
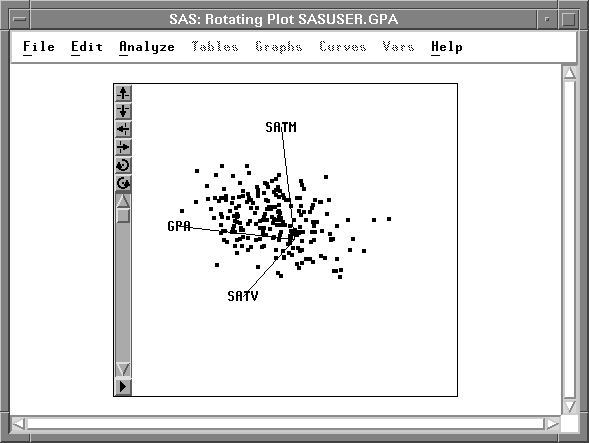
The GPA axis is not visible when the rotating
plot first appears on the display because the
Z dimension is projected into the X-Y plane.
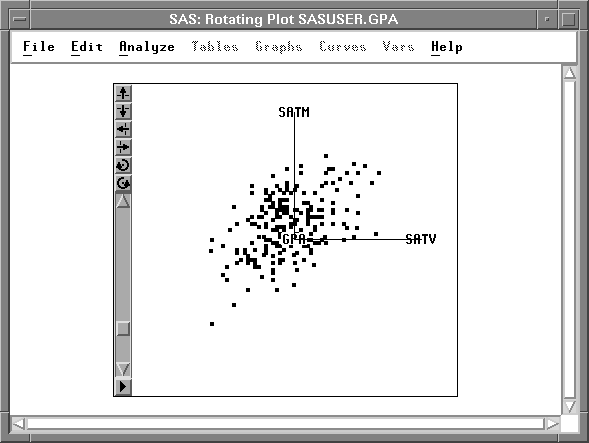
SAS/INSIGHT software provides both control buttons and a hand tool to rotate the plot. First, examine the control buttons at the left of the plot. The top two buttons rotate the plot up and down. The next two buttons rotate the plot left and right. The last two buttons rotate the plot clockwise and counter-clockwise. You can use these buttons by clicking, pressing, Shift-clicking, and Ctrl-clicking.
| Click the top rotation button and release it. |
The plot rotates a small increment and
stops when you release the button.
| Press the clockwise rotation button and hold it down. |
The plot rotates clockwise as long as you hold the button down.
| Press the Shift key and click any of the buttons. |
The plot rotates continuously until you click another button.
| Press the Ctrl key and click any of the buttons. |
This also rotates the plot continuously until you click another button.
Below the directional buttons is a slider to control the speed of rotation. When the slider is at the top, rotation is at maximum speed.
| Drag the slider, then try the control buttons again to rotate at different speeds. |
The buttons offer precise control of rotation, but the hand tool offers greater flexibility. Using the hand tool, you can rotate about any axis.
| Choose Edit:Windows:Tools to display the tools window. |
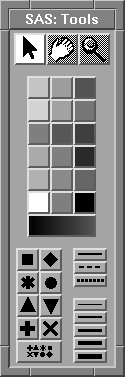
| Click the Hand tool at the top of the Tools window. |
The cursor changes to a hand.
| Click and drag the hand in the rotating plot. |
When you use the hand tool, the plot acts as a freely rotating sphere. When you click with the hand, the plot rotates a small increment. When you drag the hand, the plot follows your motion. The plot rotates as long as you press the mouse button and hold it down. If you release the button while you are dragging the hand, the plot continues rotating in the direction you were dragging.
You can use the hand without displaying the Tools window. The hand is active in each corner of the plot.
| Click the Arrow tool at the top of the Tools window. |
The cursor changes to an arrow.
| Move the Arrow tool to any corner of the rotating plot. |
The cursor changes to a hand.
Click or drag the hand to rotate the plot.
| Click on the button in the lower left corner of the plot. |
This calls up the rotating plot pop-up menu.
You can customize the appearance of the rotating
plot with the choices on this menu.
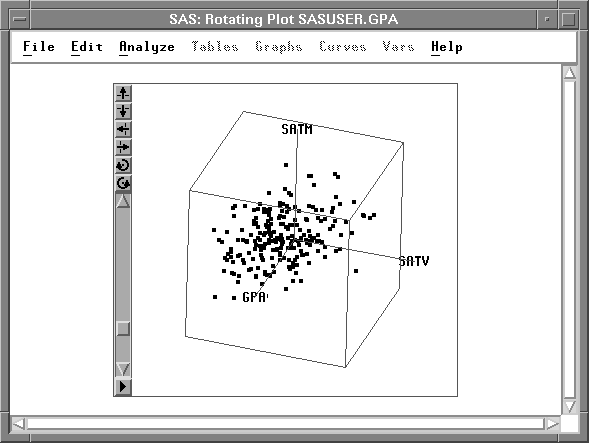
| Choose Cube. |
![[menu]](images/threq2.gif)
Figure 6.8: Rotating Plot Pop-up Menu
This draws a cube around the point cloud. The cube shows the range of the data and aids in maintaining visual orientation.
| Choose Depth from the pop-up menu. |
This draws distant markers smaller than near markers
to serve as a visual cue for depth perception.
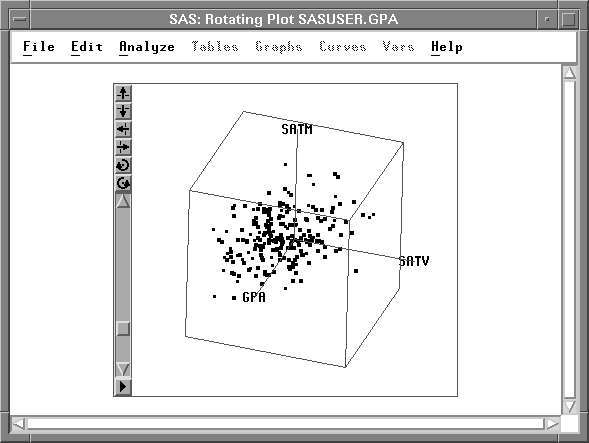
Both the Cube and the Depth choices serve as toggles, so you can choose them again to remove the cube or to return all markers to the same size. You can use other choices on the pop-up menu to toggle the display of observations and rays and to set ticks, axes, and marker sizes.
You can create a matrix of rotating plots just as you created a matrix of scatter plots in the preceding chapter. If you select more than three variables in the data window and then choose Analyze:Rotating Plot ( Z Y X ), you create a matrix containing one rotating plot for every unique combination of three variables. You can also identify observations in rotating plots just as in other plots. Click once on an observation marker to select it and to see its label. Double-click on an observation marker to display the examine observations dialog.
Related Reading | Rotating Plots, Chapter 37. |
|
Chapter Contents |
Previous |
Next |
Top |
Copyright © 1999 by SAS Institute Inc., Cary, NC, USA. All rights reserved.