Chapter Contents
Previous
Next
|
Chapter Contents |
Previous |
Next |
| EWMACHART Statement |
| See MACEW5 in the SAS/QC Sample Library |
In the manufacture of automotive tires, the diameter of the steel
belts inside the tire is measured. The following data
set contains these measurements for 30 tires:
   data tires;
      input sample diameter @@;
      datalines;
    1  24.05    2  23.99    3  23.95
    4  23.93    5  23.97    6  24.02
    7  24.06    8  24.10    9  23.98
   10  24.03   11  23.91   12  24.06
   13  24.06   14  23.96   15  23.98
   16  24.06   17  24.01   18  24.00
   19  23.93   20  23.92   21  24.09
   22  24.11   23  24.05   24  23.98
   25  23.98   26  24.06   27  24.02
   28  24.06   29  23.97   30  23.96
   ;
   proc shewhart data=tires;
      irchart diameter*sample / nochart
                                outlimits=tlimits;
   run;
A listing of the data set TLIMITS is shown in Output 20.4.1.
Output 20.4.1: Listing of the Data Set TLIMITSIn this example, reference lines will be used to display the control limits for the individual measurements on the EWMA chart. The following DATA step reads these control limits from TLIMITS and creates a data set named VREFDATA, which contains the reference line information:
   data vrefdata;
      set tlimits;
      length _reflab_ $16.;
      keep _ref_ _reflab_;
      _ref_ = _lcli_; _reflab_= 'LCL for X'; output;
      _ref_ = _ucli_; _reflab_= 'UCL for X'; output;
   run;
A listing of the data set VREFDATA is shown in Output 20.4.2.
Output 20.4.2: Listing of the Data Set VREFDATA
|
   title 'EWMA Chart for Steel Belt Diameters';
   proc macontrol data=tires;
      ewmachart diameter*sample / weight      = 0.3
                                  meansymbol  = square
                                  lcllabel    = 'LCL for EWMA'
                                  ucllabel    = 'UCL for EWMA'
                                  vref        = vrefdata
                                  vreflabpos  = 3
                                  cframe      = vibg
                                  cinfill     = ligr
                                  cconnect    = salmon
                                  cmeansymbol = yellow;
   run;
The MEANSYMBOL= option displays the individual
measurements on the EWMA chart. By default,
these values are not displayed.
The MEANSYMBOL= option specifies the symbol used to plot
the individual measurements. The VREF= option reads
the reference line information from VREFDATA.
The resulting chart is shown in Output 20.4.3.
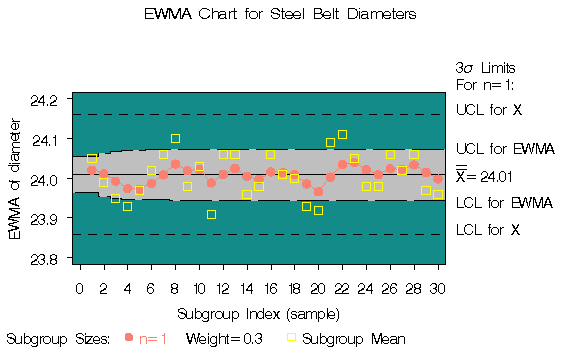
Output 20.4.3 indicates that the process is in control. None of the diameter measurements (indicated by squares) exceed their control limits, and none of the EWMAs exceed their limits.
Output 20.4.3: Displaying Individual Measurements on EWMA Chart
|
|
Chapter Contents |
Previous |
Next |
Top |
Copyright © 1999 by SAS Institute Inc., Cary, NC, USA. All rights reserved.