Chapter Contents
Previous
Next
|
Chapter Contents |
Previous |
Next |
| Details and Examples |
| See PARETO11 in the SAS/QC Sample Library |
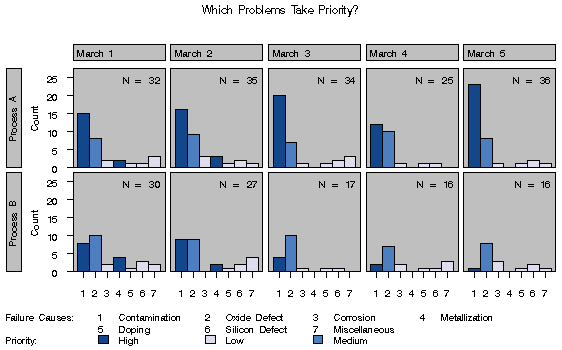
In some applications, it is useful to classify the categories into groups that are not necessarily related to frequency. This example, which is a continuation of Example 29.2, shows how you can display this classification with a bar legend.
Suppose that Contamination and Metallization are high priority problems, Oxide Defect is a medium priority problem, and all other categories are low priority problems. Begin by adding this information to the data set FAILURE4.
data failure4;
   length color $ 8 pattern $ 8 priority $ 16 ;
   set failure4;
   if cause = 'Contamination' or
      cause = 'Metallization'
   then do;
      color    = 'vigb' ;
      pattern  = 's'   ;
      priority = 'High' ;
      end;
   else
   if cause = 'Oxide Defect'
   then do;
      color    = 'bigb' ;
      pattern  = 'm5x45' ;
      priority = 'Medium' ;
      end;
   else do;
      color    = 'bwh' ;
      pattern  = 's' ;
      priority = 'Low' ;
      end;
run;
The variable PRIORITY indicates the priority, and the variables COLOR and PATTERN (character variables of length eight) provide colors and patterns corresponding to the levels of PRIORITY. The pattern values S and M5X45 correspond to a solid fill and a crosshatched fill, respectively.
The following statements specify PRIORITY as a BARLEGEND= variable, COLOR as a CBARS= variable, and PATTERN as a PBARS= variable:
   title 'Which Problems Take Priority?';
   proc pareto data=failure4;
      vbar cause / class       = ( process day )
                   freq        = counts
                   nrows       = 2
                   ncols       = 5
                   last        = 'Miscellaneous'
                   scale       = count
                   cbars       = ( color )
                   barlegend   = ( priority )
                   barleglabel = 'Priority:'
                   catleglabel = 'Failure Causes:'
                   cframe      = ligr
                   cframeside  = ligr
                   cframetop   = ligr
                   intertile   = 1.0
                   nohlabel
                   nocurve
                   nlegend ;
   run;
Note that the BARLEGEND=, CBARS=, and PBARS= variable names are enclosed in parentheses. (Parentheses are not used when you specify fixed colors and patterns with the CBARS= and PBARS= options, as in Example 29.2.)
The chart is displayed in Output 29.4.1. The levels of the BARLEGEND= variable are the values displayed in the legend labeled Priority: at the bottom of the chart.
In general, when you create CBARS=, PBARS=, and BARLEGEND= variables, their values must be consistent and unambiguous. You must assign distinct color and pattern values to the CBARS= and PBARS= variables for each level of the BARLEGEND= variable. It is not necessary to specify a PBARS= variable to accompany a BARLEGEND= variable, and if a PBARS= variable is omitted, the bars are filled with solid colors.
For further details, see the entries for the BARLEGEND=, CBARS=, and PBARS= options in "Dictionary of Options" .
Output 29.4.1: Highlighting Selected Subsets of Categories

|
|
Chapter Contents |
Previous |
Next |
Top |
Copyright © 1999 by SAS Institute Inc., Cary, NC, USA. All rights reserved.