Chapter Contents
Previous
Next
|
Chapter Contents |
Previous |
Next |
| INSET and INSET2 Statements |
   data wafers;
      input batch @;
      do i=1 to 5;
         input diamtr @;
         output;
         end;
      drop i;
   datalines;
    1  35.00 34.99 34.99 34.98 35.00
    2  35.01 34.99 34.99 34.98 35.00
    3  34.99 35.00 35.00 35.00 35.00
    4  35.01 35.00 34.99 34.99 35.00
    5  35.00 34.99 34.98 34.99 35.00
    6  34.99 34.99 35.00 35.00 35.00
    7  35.01 34.98 35.00 35.00 34.99
    8  35.00 35.00 34.99 34.98 34.99
    9  34.99 34.98 34.98 35.01 35.00
   10  34.99 35.00 35.01 34.99 35.01
   11  35.01 35.00 35.00 34.98 34.99
   12  34.99 34.99 35.00 34.98 35.01
   13  35.01 34.99 34.98 34.99 34.99
   14  35.00 35.00 34.99 35.01 34.99
   15  34.98 34.99 34.99 34.98 35.00
   16  34.99 35.00 35.00 35.01 35.00
   17  34.98 34.98 34.99 34.99 34.98
   18  35.01 35.02 35.00 34.98 35.00
   19  34.99 34.98 35.00 34.99 34.98
   20  34.99 35.00 35.00 34.99 34.99
   21  35.00 34.99 34.99 34.98 35.00
   22  35.00 35.00 35.01 35.00 35.00
   23  35.02 35.00 34.98 35.02 35.00
   24  35.00 35.00 34.99 35.01 34.98
   25  34.99 34.99 34.99 35.00 35.00
   ;
   title 'Mean Chart for Diameters';
   proc shewhart data=wafers;
      xchart diamtr*batch /
         lsl      = 34.97
         usl      = 35.03
         cframe   = bibg
         cinfill  = ligr
         cconnect = red;
      inset lsl usl cp stddev / cfill  = ywh
                                height = 3;
   run;
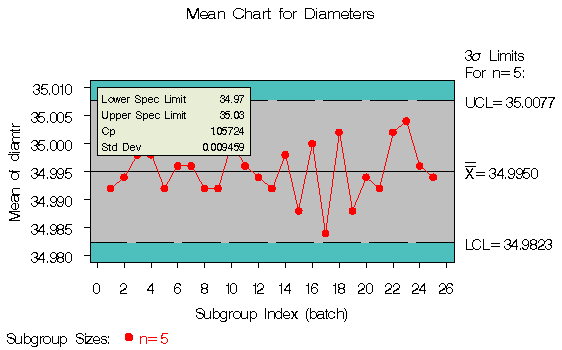
The resulting ![]() chart is displayed in Figure 45.1.
The INSET statement immediately follows the chart statement that
creates the graphical display (in this case, the XCHART statement).
Specify the keywords for inset statistics (such as LSL, USL, CP and
STDDEV) immediately after the word INSET. The inset statistics
appear in the order in which you specify the keywords.
The HEIGHT= option on the INSET statement specifies the text
height used to display the statistics in the inset.
chart is displayed in Figure 45.1.
The INSET statement immediately follows the chart statement that
creates the graphical display (in this case, the XCHART statement).
Specify the keywords for inset statistics (such as LSL, USL, CP and
STDDEV) immediately after the word INSET. The inset statistics
appear in the order in which you specify the keywords.
The HEIGHT= option on the INSET statement specifies the text
height used to display the statistics in the inset.
A complete list of keywords that you can use with the INSET statement is provided in "Summary of INSET Keywords". Note that the set of keywords available for a particular display depends on both the plot statement that precedes the INSET statement and the options that you specify in the plot statement.

|
The following examples illustrate options commonly used for enhancing the appearance of an inset.
|
Chapter Contents |
Previous |
Next |
Top |
Copyright © 1999 by SAS Institute Inc., Cary, NC, USA. All rights reserved.