Chapter Contents
Previous
Next
|
Chapter Contents |
Previous |
Next |
| The GAGE Application |
Display A.7: Analysis Button Options

|
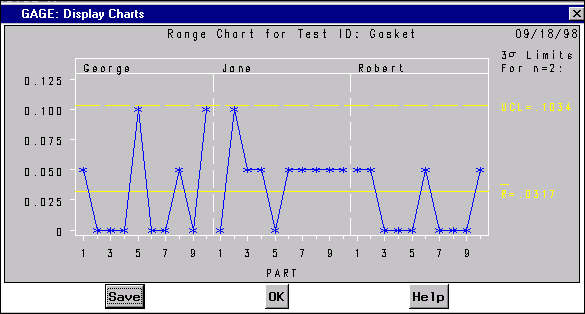
Select Range Chart. The range chart of the data is displayed, as shown in Display A.8.
No points are out-of-control, and the variability across operators is fairly comparable. This indicates that all operators are using the gage in the same way. If there were any out-of-control points, they should be investigated and dealt with before proceeding.
Display A.8: Range Chart for Gage Study Gasket

|
You can save this chart in a SAS graphics catalog. Then you can use the GRAPH window or the GREPLAY procedure to view charts stored in the catalog. You also can create hard-copy versions of charts stored in the catalog.
Press the ![]() button to save the range chart.
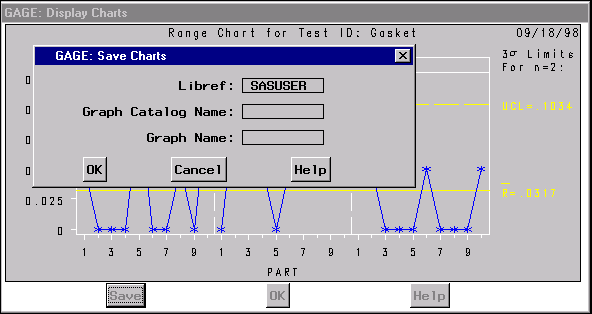
The Save Charts window appears, as shown in Display A.9.
button to save the range chart.
The Save Charts window appears, as shown in Display A.9.
Display A.9: Saving the Range Chart

|
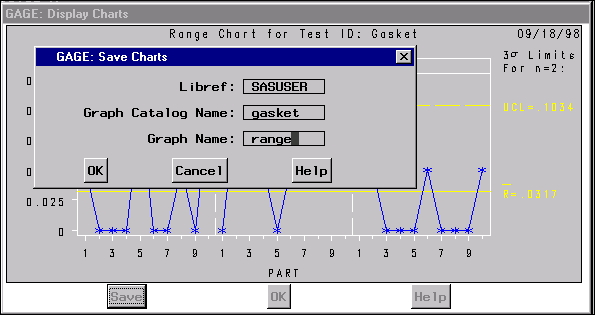
Display A.10 shows that the range chart is to be stored in SASUSER.GASKET.RANGE.
Display A.10: Saving the Range Chart

|
Press the ![]() button if you decide not to
save the chart.
Press the
button if you decide not to
save the chart.
Press the ![]() button to save the chart.
button to save the chart.
You return to the window displaying the range chart.
Press the ![]() button to leave the
Display Charts window.
button to leave the
Display Charts window.
Refer to SAS/GRAPH documentation for more information on SAS graphics catalogs, the GRAPH window, and the GREPLAY procedure.
|
Chapter Contents |
Previous |
Next |
Top |
Copyright © 1999 by SAS Institute Inc., Cary, NC, USA. All rights reserved.