Book Contents
Previous
Next
|
Book Contents |
Previous |
Next |
| SAS/OR: The QSIM Application |
An additional feature is the ability to accumulate the sample paths in SAS data sets. See Chapter 7, "Saving and Restoring," for more information. With these data in data sets, you can write your own programs to do more sophisticated analyses.
When calculating statistics, QSIM uses the following measures of system performance:
In addition, statistics can be calculated on samples of random variables, which are user-defined attributes.
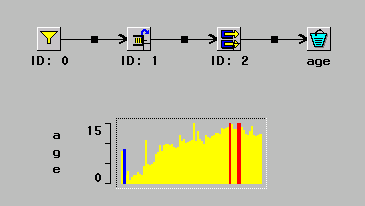
To illustrate some of the analysis features, this chapter uses the multiple-server, single-input queueing model shown in Figure 8.1.

|
The inter-arrival time distribution is E(.33) and the service time distribution for each server is E(1). Transactions queue in a FIFO discipline and go to the first available server. This corresponds to the type of queueing that you encounter at check-in in many airports.
|
Book Contents |
Previous |
Next |
Top |