Chapter Contents
Previous
Next
|
Chapter Contents |
Previous |
Next |
| The FASTCLUS Procedure |
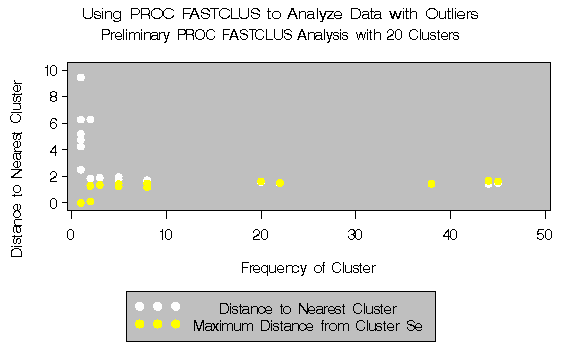
The second example involves data artificially generated to contain two clusters and several severe outliers. A preliminary analysis specifies twenty clusters and outputs an OUTSEED= data set to be used for a diagnostic plot. The exact number of initial clusters is not important; similar results could be obtained with ten or fifty initial clusters. Examination of the plot suggests that clusters with more than five (again, the exact number is not important) observations may yield good seeds for the main analysis. A DATA step deletes clusters with five or fewer observations, and the remaining cluster means provide seeds for the next PROC FASTCLUS analysis.
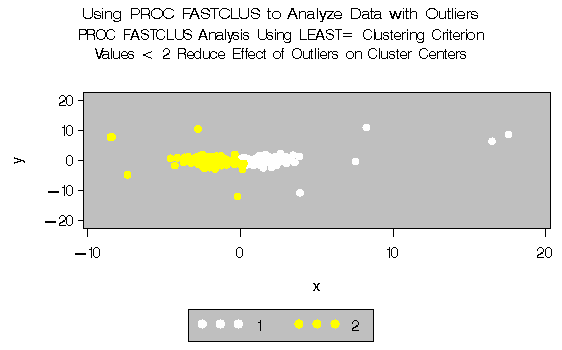
Two clusters are requested; the LEAST= option specifies the mean absolute deviation criterion (LEAST=1) . Values of the LEAST= option less than 2 reduce the effect of outliers on cluster centers.
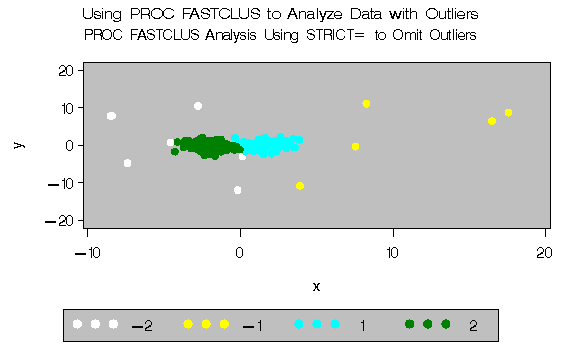
The next analysis also requests two clusters; the STRICT= option is specified to prevent outliers from distorting the results. The STRICT= value is chosen to be close to the _GAP_ and _RADIUS_ values of the larger clusters in the diagnostic plot; the exact value is not critical.
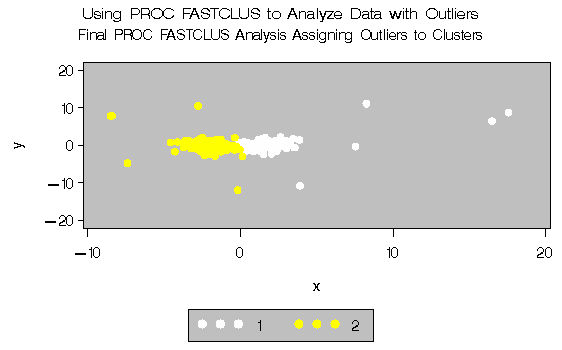
A final PROC FASTCLUS run assigns the outliers to clusters. The results are displayed in Output 27.2.1 through Output 27.2.4.
   /*   Create artificial data set with two clusters         */
   /*   and some outliers.                                   */

   data x;
   title 'Using PROC FASTCLUS to Analyze Data with Outliers';
      drop n;
      do n=1 to 100;
         x=rannor(12345)+2;
         y=rannor(12345);
         output;
      end;
      do n=1 to 100;
         x=rannor(12345)-2;
         y=rannor(12345);
         output;
      end;
      do n=1 to 10;
         x=10*rannor(12345);
         y=10*rannor(12345);
         output;
      end;
   run;

   /* Run PROC FASTCLUS with many clusters and OUTSEED= output */
   /* data set for diagnostic plot.                            */

   title2 'Preliminary PROC FASTCLUS Analysis with 20 Clusters';
   proc fastclus data=x outseed=mean1 maxc=20 maxiter=0 summary;
      var x y;
   run;

   legend1 frame cframe=ligr label=none cborder=black
           position=center value=(justify=center);

   axis1 label=(angle=90 rotate=0) minor=none order=(0 to 10 by 2);
   axis2 minor=none ;

   proc gplot data=mean1;
        plot  _gap_*_freq_ _radius_*_freq_ /overlay frame
        cframe=ligr vaxis=axis1 haxis=axis2 legend=legend1;
   run;
Output 27.2.1: Preliminary Analysis of Data with Outliers:
PROC FASTCLUS and PROC GPLOT
|
      /*    Remove low frequency clusters.  */
   data seed;
      set mean1;
      if _freq_>5;
   run;

      /*   Run PROC FASTCLUS again, selecting seeds from the          */
      /*   high frequency clusters in the previous analysis           */
      /*   using LEAST=1 Clustering Criterion                         */

   title2 'PROC FASTCLUS Analysis Using LEAST= Clustering Criterion';
   title3 'Values < 2 Reduce Effect of Outliers on Cluster Centers';
   proc fastclus data=x seed=seed maxc=2 least=1 out=out;
      var x y;
   run;

   legend1 frame cframe=ligr label=none cborder=black
           position=center value=(justify=center);
   axis1 label=(angle=90 rotate=0) minor=none;
   axis2 minor=none;

   proc gplot data=out;
      plot y*x=cluster/frame cframe=ligr
                     legend=legend1 vaxis=axis1 haxis=axis2;
   run;
Output 27.2.2: Analysis of Data with Outliers using the LEAST= Option|
| |||||||||||||||||||||
|
| |||||||||||||||||||||||||||||||||||||||||||||
|
| |||||||||||||||||||||||||||||||||||||||||||||||||||||||||||
|
      /*   Run PROC FASTCLUS again, selecting seeds from the        */
      /*   high frequency clusters in the previous analysis         */
      /*   STRICT= prevents outliers from distorting the results.   */

   title2 'PROC FASTCLUS Analysis Using STRICT= to Omit Outliers';
   proc fastclus data=x seed=seed
        maxc=2 strict=3.0 out=out outseed=mean2;
      var x y;
   run;

   proc gplot data=out;
      plot y*x=cluster/frame cframe=ligr
                     legend=legend1 vaxis=axis1 haxis=axis2;
   run;
Output 27.2.3: Cluster Analysis with Outliers Omitted: PROC FASTCLUS and PROC GPLOT|
| |||||||||||||||||||||||||||||||||||||||||||||||||||||||||||||||||||||||||||||||
|
| ||||||||||||||||||||||||||||
|
      /* Run PROC FASTCLUS one more time with zero iterations */
      /* to assign outliers and tails to clusters.            */
   title2 'Final PROC FASTCLUS Analysis Assigning Outliers to '
          'Clusters';
   proc fastclus data=x seed=mean2 maxc=2 maxiter=0 out=out;
      var x y;
   run;


   proc gplot data=out;
      plot y*x=cluster/frame cframe=ligr
                     legend=legend1 vaxis=axis1 haxis=axis2;
   run;
Output 27.2.4: Final Analysis with Outliers Assigned to Clusters: PROC
FASTCLUS and PROC GPLOT|
| ||||||||||||||||||||||||||||||||||||||||||||||||||||||||||||||||||||||||||||||
|
| ||||||||||||||||||||||||||||
|
|
Chapter Contents |
Previous |
Next |
Top |
Copyright © 1999 by SAS Institute Inc., Cary, NC, USA. All rights reserved.