Chapter Contents
Previous
Next
|
Chapter Contents |
Previous |
Next |
| The LOESS Procedure |
The following data set records the results of an experiment to determine how the yield of a chemical reaction varies with temperature and amount of a catalyst used.
  data Experiment;
     input Temperature Catalyst Yield;
  datalines;
    80      0.000      6.842
    80      0.002      7.944
    .
    .     more data lines
    .
   140      0.078      4.012
   140      0.080      5.212
  ;
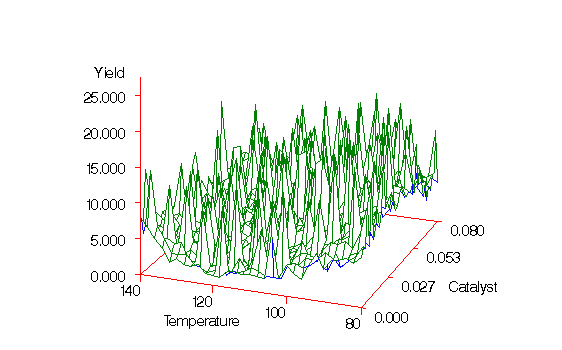
Researchers know that about 10% of the yield measurements are corrupted due to an intermittent equipment problem. This can be seen in the surface plot of raw data shown in Output 38.3.1.
   proc g3d data=Experiment;
      plot Temperature*Catalyst=Yield/zmin=0 zmax=25 zticknum=6;
   run;
Output 38.3.1: Surface Plot of Experiment Data
|
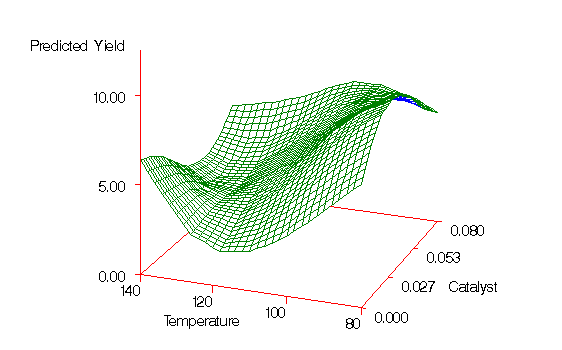
A robust fitting method is needed to estimate the underlying surface in the presence of data outliers. The following statements invoke PROC LOESS with iterative reweighting to fit a surface to these data:
   proc loess data=Experiment;
      ods output OutputStatistics=Results;
      model Yield = Temperature Catalyst /
                            scale=sd(0.1)
                            smooth=0.1
                            iterations=3;
   run;
The ITERATIONS=3 option in the MODEL statement requests two iteratively reweighted iterations. Note the use of the SCALE=SD(0.1) option in the MODEL statement. This specifies that the independent variables in the model are to be divided by their respective 10% trimmed standard deviations before the fitted model is computed. This is appropriate as the independent variables Temperature and Catalyst are not similarly scaled. The "Scale Details" table produced by PROC LOESS is shown in Output 38.3.2.
Output 38.3.2: Scale Details Table
   proc g3d data=Results;
      format Temperature f4.0;
      format Catalyst f6.3;
      format pred f5.2;
      plot Temperature*Catalyst=pred/zmin=0 zmax=10 zticknum=3;
   run;
Output 38.3.3: Fitted Surface Plot for Experiment Data
|
|
Chapter Contents |
Previous |
Next |
Top |
Copyright © 1999 by SAS Institute Inc., Cary, NC, USA. All rights reserved.