 |
SOUND-ENVIRONMENT INTERACTION |
Sound Propagation in Open and Enclosed Spaces
|
SOUND-ENVIRONMENT INTERACTION |
Sound interacts with actual environments in complex ways that are affected by nearly every aspect of the physical environment. The propagation of a sound wave in air, for instance, is influenced by all atmospheric conditions, and also by the processes of reflection, absorption and transmission at every surface with which it comes into contact. Such information is useful in predicting and describing how sound behaves in any given environment, and also in controlling or manipulating its behaviour in environments where acoustic communication has a special role.
Psychoacoustics offers related information explaining how the human auditory system localizes sounds, extracts spatial cues from the environment, and allows us to create a sense of Acoustic Space. Soundscape studies is concerned with the notation of spatial aspects of the acoustic environment, and the information extracted by listeners from the spatial behaviour of sounds. These topics will be dealt with in the next module.
Likewise, electroacoustic devices that interact with sound environments in the way in which they record and reproduce spatial information, whether in imitation of the natural environment, or completely artificially, will also be dealt with in a separate module. Topics that we deal with here, such as phasing, echo and reverberation are also very important in electroacoustic studio work, and have parts of modules devoted to these topics from a production point of view. You can find this material in these links for phasing, echo and time delays, reverberation and impulse reverberation.The specific sub-topics presented here are:
A) Sound propagation characteristics influenced by environmental factorsB) Incidence and reflection phenomena
C) Reverberation and its perception
D) Absorption and transmission phenomena
E) Complex propagation phenomena (phasing and Doppler shift)
F) Resonance, eigentones and standing waves in enclosed spaces
Q) Review Quiz
home
A) Sound Propagation. In the first module, we began with the basic process of acoustic radiation, that is, the transfer of sound energy from the source to the medium, which we mainly assumed to be the air. We found that this transfer of energy in the form of a sound wave is not always very efficient, and if we want to improve it purely acoustically (as opposed to amplifying it electroacoustically), we need to use natural acoustic amplification methods such as attaching the source to a resonator. Likewise, if we want to impede the transfer, as with noise, we need to damp the vibration, decouple it from physical contact with other surfaces, or isolate the sound source itself.
In this module, we will describe how the sound wave, now radiated into the air or other medium, travels through it and interacts with the surroundings. This behaviour is called sound propagation, and it will depend on the acoustic nature of the environment. Acousticians make a basic distinction between an idealized environment with no obstacles to propagation, called free field conditions, and those that occur in enclosed spaces where the propagating behaviour is much more complex.
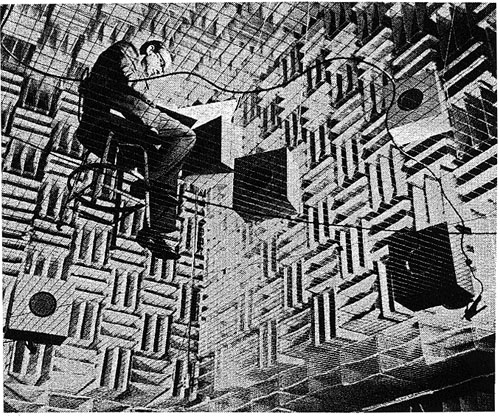
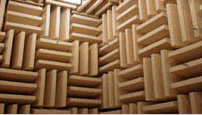
Free field conditions can be simulated in an anechoic chamber where all surfaces are highly absorbent, and even the floor may be a wire grid. This kind of acoustically neutral space is useful for testing sound sources, but can be very disorienting to a listener, since essentially there is no sense of acoustic space. The lack of reflected sound means that there is no spatial feedback for the listener, an experience that highlights how accustomed we are to orienting ourselves spatially through sound.
There are no naturally occurring free field conditions, but a wide open space such as a desert or prairie might come close, even though the ground cover will still make a difference. At the opposite end of the spatial continuum lies the diffuse sound field where there is maximum reflection of sound, minimum absorption, and likewise a possible disorientation of the listener because there is little directionality to incoming sounds, and one might feel that it’s like you are “swimming” in the sound.
An anechoic chamber
ANECHOIC SPACE ––––>
<–––– INTERACTIVE SPACE ––––>
<–––– DIFFUSE SOUND FIELD
maximum absorption
minimum reflection
balance of absorption
and reflection
maximum reflection
minimum absorption
"the sound is the sound"
sound and space interact
"the sound is the space"
A brick struck in an anechoic chamber Granville Island Market, Vancouver Entering a public swimming pool, Vancouver
This chart suggests a continuum of acoustic spaces based on propagation characteristics, ranging from anechoic to diffuse sound fields, with interactive spaces in the middle. The continuum also ranges from a hyper-clarity of the struck brick with essentially “no space”, through an acoustically rich and balanced public space, popular with both tourists and locals, where a multitude of sounds can be easily discerned, through to a diffuse sound field where the maximum reflections from hard surfaces, glass and water provide little clarity, and amplify the shouting and other activities. We need to build up more familiarity with acoustic propagation to fully understand these situations, so we will now return to free field propagation.
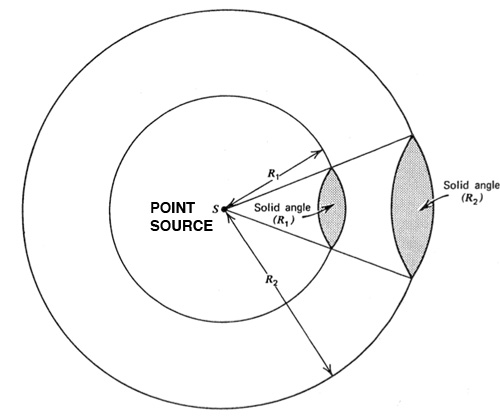
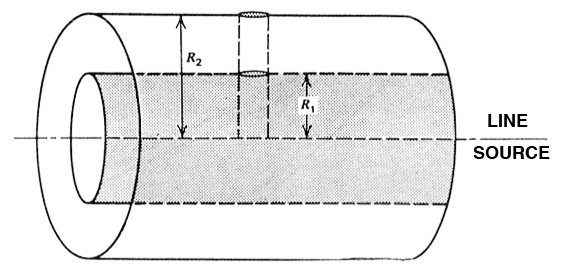
Sound propagating in outdoor environments is subject to a variety of influences which modify the normal spreading of the sound wave. These are classified broadly as atmospheric effects and surface effects which will be dealt with below. The geometric spreading of the sound wave itself can be modelled in two simple and idealized configurations, namely the point source and the line source, as shown below. The geometry of each configuration is very simple – a sphere in the case of a point source, and a cylinder with a line source – such that it is easy to predict how much energy will be lost, simply by having it spread out over a larger volume. In other words, the geometric complexity of an actual sound source is reduced to imagining it as a “point” (maybe like seeing it from a vast height). The line source is defined as a configuration where approximately equal amounts of acoustic energy emanate from every point on the line.
Two questions: what might be an example of a line source, and if you were the same distance from a point source and a line source, and somehow each was emitting the same amount of energy, which would be louder at a given distance? Answer here.The loss of energy from the sound wave being spread over a broader volume of air is measured as the decibel loss per doubling of distance, ignoring atmospheric or surface effects. The theoretical result of this comparison is the rule that acoustic loss is 6 dB per doubling of distance from a point source, and 3 dB from a line source. This finding is described as the Inverse-Square Law and was referenced in the Magnitude Module. The accompanying chart in the link allows the theoretical correction of a level (e.g. for a bylaw) when sound levels at two distances from the source are being compared.
In the above diagrams there is a graphic intent to represent a 3-dimensional volume. In the case of the point source, a section of the sphere at a doubled distance attempts to show how the energy will be spread out with distance, and likewise for the cross-section of the cylinder. So, in the answer for the question that was posed above, it’s louder to live near a line source such as a busy highway, than a point source like a factory, assuming of course they are emitting the same amount of energy.
Atmospheric effects. One of the very few invariant properties of sound propagation is that all frequencies travel at the same speed, thereby ensuring that the initial vibration at the source is transmitted synchronously to the ear, (i.e. in phase). Because of this uniformity of speed, the vibration received by the eardrum or a microphone is analogous to that of the source. Therefore, it is not surprising that we traditionally “bond” the sound with the source, both for identification of it, and for information related to how the vibration was started and how it continues.
However, once the sound wave begins to propagate, everything affects the frequency spectrum. The sensory metaphor that sound is “coloured” by the acoustic environment captures these effects. The first level of frequency dependence is the atmosphere itself, but the effects are at a molecular level and therefore often non-intuitive. The scientific process is called molecular relaxation, and the general outcome of this process is that high frequencies are absorbed more than low.
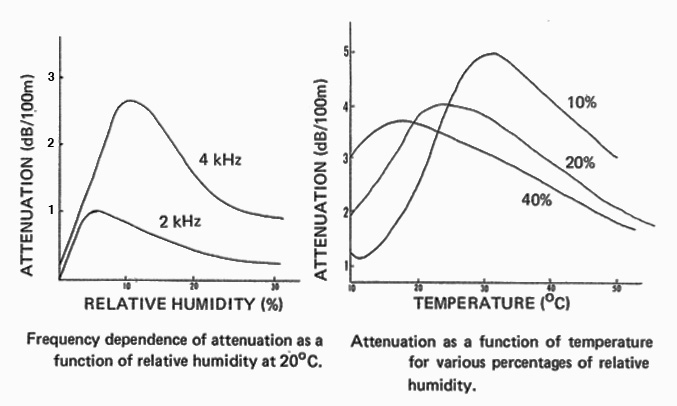
However, there are many subtleties once temperature and relative humidity are considered. The follow diagrams show the reduction or attenuation of sound energy in the atmosphere in decibels per 100 metres, according to relative humidity (left) and temperature and humidity (right).
The lefthand diagram shows that there is more air absorption at low humidity (10%) than at higher values, and high frequencies are absorbed more than the lows. The peaks in the righthand diagram show at what temperature there is the most absorption for a low humidity situation (namely around 30°C), as well as for higher humidity situations. Taken together, these graphs show that desert conditions (low humidity, higher temperatures) result in greater sound absorption, particularly at higher frequencies.
In other words, it would be naive to think that the water droplets in the air at high humidity somehow absorb more sound energy. In fact, it is desert conditions (low humidity, higher temperature) that sees higher absorption levels.
This is a good moment to consider how we learn to understand sound levels at various visual distances. In a desert situation, there are usually few visual obstacles and so we see mountains, for instance, and think they are a certain distance away, particularly if you are a visitor coming from a different type of environment, e.g. maritime or forested. The paradox is that what you see is probably much more distant than you imagine, but paradoxically, sound doesn’t “carry” as far, as predicted by the above diagrams for low humidity, high temperature conditions. In fact, the soundscape in a desert is almost anechoic, even as it seems visually expansive.
Similarly, in a maritime situation, or a temperate landscape with a lot of lakes and ponds, you will be used to sound carrying quite well over the water. That is because a water surface is almost a perfect reflector. For someone unused to being around water, it will be surprising how far out on the water the sound source is located, compared to how it would sound if the sound was traveling over land.
Therefore, in terms of perceived acoustic space, listeners will have a sense of distance traded off with loudness based on typical environmental conditions. But sometimes, the listener’s interpretation can be misleading, even in familiar situations. For instance, one often hears that it’s quieter when it’s snowing. Just as we’ve stated that humidity and precipitation (rain) has no significant effect on atmospheric absorption, neither does snow. We need to look at surface effects instead, as discussed below. Tires on a rainy pavement are louder, but on snow, they are probably quieter. Vehicles are less likely to be moving as fast, and may be less frequent overall.
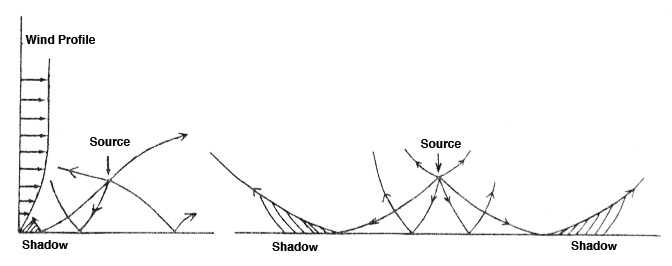
Before we proceed to surface effects, we should note a much stronger effect on sound levels than atmospheric absorption, namely wind and temperature gradients. When a wind is blowing there will always be a wind gradient, that is, the wind speed will be greater the higher it goes. Think of climbing even a small hill and noticing more wind. This means sound is scattered from a normal geometric spreading, and in fact, once we take into account reflections off the ground, there may be places of less sound, called a sound shadow, as shown in this diagram.
Bells in the wind at Percé, Québec
Source: WSP Canada 52, take 1
As you can clearly hear in this recording, a fixed source, the sound of a peal of bells, recorded on a hillside about 100 yards from the church, is constantly being scattered by the wind, which can cause up to 20 dB of variation in levels. Familiarity with the sound could easily lead to an aural assessment of wind strength.
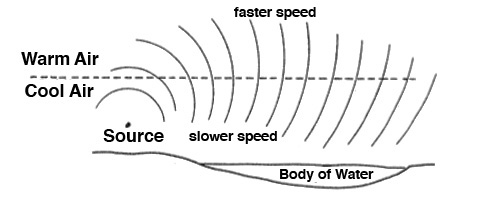
Under conditions of a temperature inversion, that is, a layer of warm air over top of a cooler one, the sound waves will travel at different speeds in each layer, faster at the top and slower at the bottom. This causes the wavefront to bend, the phenomenon termed refraction. This temperature inversion causes the sound wave to bend downwards and be heard at father distances than normal.
Conversely, a normal gradient (cool air above warm) will cause the wave to bend upwards, and the sound will not be heard as far. If a body of water intervenes, it cools more slowly than the land, and this can cause an additional temperature gradient. These effects may be more common at sunset or in winter.
Surface Effects. Ground absorption. The ground itself can absorb acoustic energy depending on its composition or mode of covering. Smooth, hard surfaces will cause strong reflections, whereas thick grass can cause significant absorption, particularly at higher frequencies.
Refraction (bending) of a sound wave under conditions of temperature inversion.
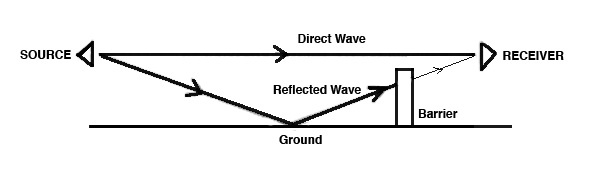
Reflected sound coming off the ground can actually cause a reduction is sound levels. In the Sound-Sound Interaction module, we will discuss destructive interference, which is when two related sound waves line up in such a way that one (the reflected sound in this case) is out of phase with the direct wave and results in some degree of cancellation. This version is called ground effect and is strongest when the source and listener are both close to the ground, and low mid-range frequencies (200-600 Hz) are most likely to affected.
However, this means of reducing sound levels can be negated if a barrier does not block what is called “line of sight” between source and listener. As shown in the diagram, the barrier interferes only with the reflected wave, thus minimizing any cancellation of sound levels. Therefore, a short wall less than 6 feet (2 m) will be ineffective in terms of noise reduction. It must be high enough (without any air cracks) to obscure both line of sight and the reflected wave to be effective, and even then, some lower frequencies will move around it, as discussed below under diffraction).
Surface Effects. Attenuation due to barriers and trees. Visual and acoustic barriers often have different and contrasting roles and importance in different cultures. For instance, in traditional Japanese culture, a translucent (but not transparent) wall seems to be sufficient to provide privacy, whereas it has little effect on sound transmission. In Europe, it is customary to have double-glazed windows and heavy doors, usually kept closed to provide both visual and aural privacy. In subtropical climates, windows are almost always open, so eavesdropping on your neighbours and the whole local community is a constant fact of life.
Landscape design, similarly, can provide an aesthetic version of visual privacy, but unfortunately, a line of trees or shrubs provides little attenuation of sound levels. The problem is that there is too much airspace around these “barriers” and those spaces, even small cracks, allow sound to travel through them unimpaired.
7. Personal listening experiment. Position yourself with a door in between you and a constant sound source. Try closing the door in stages, a fraction at a time, and noticing if there any change in loudness. As you come to the final stage, notice if the last position before the door is shut makes a significant difference. If you get stuck in traffic beside a loud truck, try the same experiment by rolling up the window beside you. Also, if you wear your hair long, try listening to the same sound with hair covering your ears, and without. Does it make a difference? Answer here.On the other hand, there is a positive aspect of this propagation effect that is used by recordists – a wind screen (or windshield) – that allows the sound wave to pass through the protection, but to attenuate the turbulence caused by the wind against the microphone which results in low frequency distortion. This characteristic of porous objects is that they are said to be acoustically transparent. See the Field Recording module for more detail.
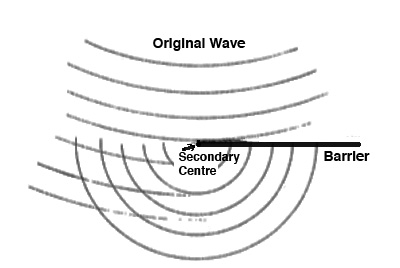
Diffraction. The ability of a sound to travel around a barrier, i.e. to diffract around it, depends on the relative size of the barrier and the wavelength of the sound. In general, the long wavelengths of low frequencies easily diffract around larger objects such as the walls of a building, whereas the short wavelengths of high frequencies cannot diffract, even around the head. This diagram show a case of significant diffraction.
In acoustic terms, the barrier actually acts like a secondary source, creating its own pattern of waves that can easily extend around the barrier. Not shown is the high frequency case, where a sound shadow would be easily noticed on the opposite side of the barrier, that is, an area of reduced loudness. Something similar happens with water waves. A breakwater to protect a harbour must be very long to prevent the wave action from going around it, whereas a log floating on the water will not affect the waves at all.
8. Personal listening experiment. Go on a soundwalk and pay particular attention to how the spectrum of the sounds you hear changes when you go past buildings, and even smaller obstacles, or around corners. You’ll probably notice that high frequencies are noticeably attenuated with almost any size barrier, and low frequencies are not, hence the difficulty of controlling them. Are there subtler differences you notice with more mid-range sounds?
Index
B) Incidence and reflection phenomena. If you’re unfamiliar with acoustic terminology up until now, at this point you are likely to stumble over these three sound-alike terms: refraction, reflection, diffraction. I don’t think anyone coined these terms to confuse us, but it’s easy to see why they often get mixed up. The short answer is that these are three properties of all waves, including light, where these phenomena are probably more familiar. Let’s look at the primary acoustic differences in the three terms:
- Refraction: a bending of a sound wave due to different speeds of travelBesides the similar spelling, it’s easy to see how confusion can arise, since all three phenomena involve the change of direction of a wave, but they do so for different reasons, and have different properties. For instance, the example given above of refraction in a temperature inversion shows the wave bending back downward. That might seem like a reflection, but it’s not. Refraction involves a speed difference, whereas reflection does not. Refraction is a continuous bending, whereas reflection is a sharp change of direction. The classic visual example of refraction is how a rod or stick appears bent or crooked when immersed in water.
- Diffraction: the ability of a sound wave to bend around an obstacle, or pass through a slit, depending on its wavelength
- Reflection: how a sound wave reacts at a surface by changing direction; this can also happen at the end of a tube
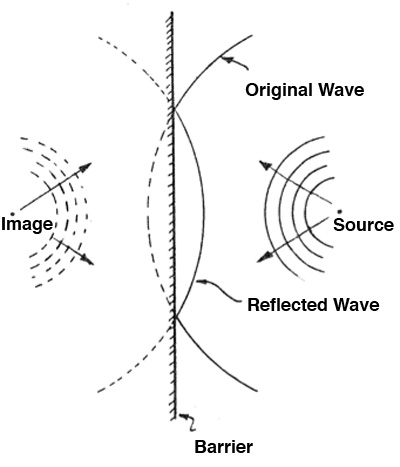
Of the three phenomena, reflection is by far the most common, since sound is constantly interacting with objects and barriers, including the ground. As shown in the diagram below, it has some interesting symmetrical properties. We’ll start by identifying the incident wave, which is what approaches the barrier, and the reflected wave which changes its direction after hitting the surface. Just as with a pool ball hitting a rail, the angle of incidence equals the angle of reflection.
However, unlike the pool ball, the sound wave has a three-dimensional wavefront that is difficult to represent in a two-dimensional diagram. Usually we get an arrow (or vector) that represents the movement of the incident and reflected waves as in the ground effect diagram above. It is interesting to compare an acoustic reflection with a visual one in a mirror since the basic process is the same, but the result is quite different.
With a mirror, we are used to seeing a mirror reflected image that appears as far on the opposite side of the mirror as the original source is in front of it. And the image we see is reversed – the mirror image – where the left side, of our face for instance, still appears on our left, whereas when someone looks at us, they see our left side on the right. For this reason, and possibly others, we often think a photograph “doesn’t look like me” because it doesn’t look like what we see in a mirror.
The same process happens with an acoustic reflection. In the diagram above the reflected wave can be thought of as emanating from a mirror source at an equal distance on the other side of the barrier (here called an "image"), spreading out in the direction of the reflected wave. But unlike the visual mirror, we don’t identify that image source as “real” in any way. The only time that might happen is with a very long delay between the sound and its reflection, which we call echo. With the visual effect, there is no discernible delay with the reflected image, so it seems as stable as the actual source.
Echo from a wooded shoreline across a small lake
from "Six Themes of the Soundscape," program 1, Soundscapes of Canada
A reflection is just one of three things that can happen to a sound wave at a barrier. The wave can be reflected off the barrier as just described, it can be absorbed by the barrier (and the energy converted to heat, but not much), and it can be transmitted through the barrier. We will deal with these latter two aspects in the next section.
Whereas light is an electromagnetic wave that travels so fast that the reflections appear simultaneous, we should always remember that sound is physical energy that travels relatively slowly, as we’ve documented in the speed of sound in different media and different temperatures. It is useful to remember that sound travels about 1 foot (.3 metre) in a millisecond (ms). So, reflections are typically measured in milliseconds, and this time scale is one that can be discerned by the brain.
In fact time delays on this order of magnitude (ms) play a very important role in aural perception that is entirely complementary to visual perception. Vision is adept at determining detail at a distance, whereas hearing is more suited for an appraisal of the surrounding acoustic space as a whole, including all events occurring within it from all directions. And micro time delays are the key to that aspect of aural perception. It is precisely these kinds of cues that enable blind people to navigate their way in the world, as articulated so beautifully by some blind authors in their books, such as Jacques Lusseyran (And There Was Light) and John Hull (Touching the Rock).
In this edited set of recordings, we jump rapidly from one acoustic space to another. Notice how quickly we get an aural impression of each location while listening to the text. It is a good example of what might be called dual processing, where we are effortlessly getting two types of information simultaneously from just the quality of the sound itself: the textual information and the spatial.
A voice recorded in multiple acoustic spaces
from "Six Themes of the Soundscape," program 1, Soundscapes of Canada9. Personal listening experiment. Recruit a friend to join you in this experiment. Choose a medium sized room to explore with only the voice. Ideally the room is fairly open so you can move around it easily. One person is the Listener, and the other is the Verbal Explorer, and you each take turns in that role. The Listener stays in the middle of the room while the Verbal Explorer moves around the space fairly slowly and keeps up a running commentary about how his or her voice sounds different in each part of the room. Pay particular attention to the corners and walls, and sometime squat down or climb up on a chair. When it is your turn to be the Listener, close your eyes, and listen to how your friend’s voice changes. Only open your eyes when you think he/she is facing you, just to check if you are correct. What does the experiment tell you about the acoustics of the room? If you have time, try the experiment again in a very different room.
Diffusion. Acoustic reflections give rise to three interrelated phenomena: echo, reverberation and diffusion. Echo is a single reflection that is delayed long enough to be perceived as a separate acoustic event, as shown above. Reverberation is the result of multiple reflections in an enclosed or semi-enclosed space where the density of reflections causes them to fuse together into a complex spatial impression. Diffusion describes the spread of sound throughout a space, usually in terms of whether it is even. Good diffusion means that the sound is distributed evenly throughout the space, and there are no “dead spots”, standing waves or sound shadows.
The term diffusion is also used in the performance of audio soundtracks in a space where the sound is diffused through multiple speakers, placed around the space such that the sound can be properly heard everywhere. The person in charge of the diffusion can also change levels, for instance, to optimize this projection of the space within the recording into the given acoustic space.
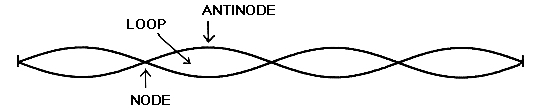
As introduced in the first Vibration module, a standing wave is the result of resonance in a string, for instance, where the pattern of nodes and loops (or anti-nodes) is fixed, that is, positions of minimum and maximum sound pressure respectively. These are desirable in a musical instrument, but not in an enclosed space. The minimum pressure point, or node, is where there is a cancellation of the wave, and the resulting impression is a “dead spot”. Conversely, a pressure peak in a standing wave could be called a “hot spot”, and the experience of constant pressure on the ears is not generally pleasant.
Similarly, we noted above that the inability of a sound to diffract around an obstacle results in a sound shadow, where the sound would be weak. All of these uneven qualities are undesirable for good diffusion where we would like to hear sound in an enclosed space at every location in it. We will return to this issue below with room resonances known as eigentones.
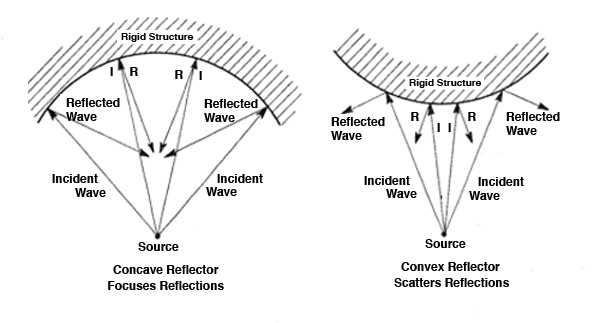
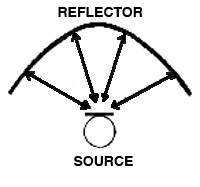
Therefore, reflection and diffraction aid in the even spread of sound in a space. Another variable is the shape of the surfaces where the reflection occurs. There is a striking difference in the behaviour of reflections in the case of concave and convex surfaces as shown here.
The concave surface (on the left) focuses all reflection back in the direction of the source, thereby “trapping” the sound instead of spreading it. In contrast, a convex or protruding surface scatters the incident wave in many directions because the reflections bounce off the curved surface differently. Keep in mind this can apply to small ridges, protuberances, and ornamentation on what otherwise might seem to be a flat surface. Therefore, convex surfaces are preferred for good diffusion of sound in a space.
In enclosed spaces, the nature and height of the ceiling is an important determinant of the acoustic properties of the space, and in particular whether sound reaches listeners optimally. A ceiling that is too high will dissipate the sound and not reflect it back to an audience, a typical issue of school gymnasiums and ice rinks, particularly when combined with highly reflective floors and walls. The resulting reverberation will easily mask even an amplified voice, for instance. In this recording inside a skating rink, the highly reflective surfaces and high ceiling amplify the voices (thereby encouraging them to get even louder).
Skating rink, Vancouver
Source: WSP VDAT 8 take 23
click to enlarge
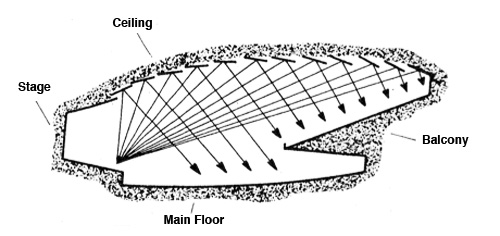
A better solution for an auditorium is shown here where sound is allowed to reflect off the ceiling directly to the audience.
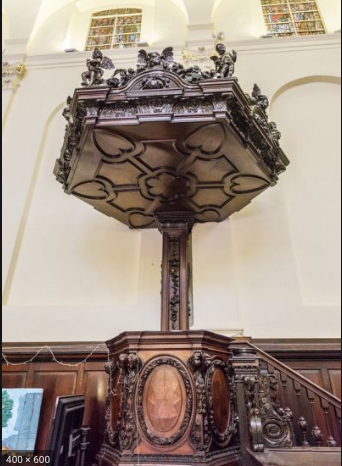
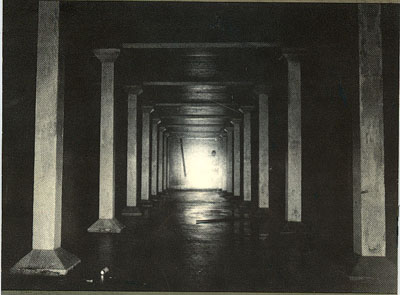
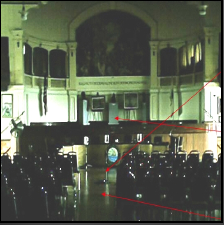
In the days before public address systems were installed in churches, a wooden sounding board (not to be confused with the soundboard of a piano) was often placed above the pulpit, and sometimes angled up a bit, as shown below from a church in the UK. Given the high ceilings of most churches, the spoken voice could easily be lost in the reverberation of the space.
Symmetrical Reflections. Perhaps because almost all reflections, except echo, are largely random and uncorrelated, those special cases that arise from a symmetrical geometry are often fascinating. The one that generally isn’t is called canyon effect, and is most commonly found in urban centres with streets lined with parallel buildings on each side. Sounds bounce back and forth because of the high degree of reflectivity in the concrete, steel and glass, essentially creating a diffuse sound field. Moreover, low frequencies can diffract around corners, and therefore sound is coming from all directions. We noted above that such a diffuse sound field can be disorienting as any sense of acoustic space becomes undefined and confusing.
On the other hand, a curved or parabolic shape, similar to the concave example above, can produce a repetitive echo called a slap echo, because all waves are reflected back to the central position.
Slap echo in Place Victoria Metro station, Montréal
Probably the most famous example of symmetrical reflections is the “whispering gallery” phenomenon, such as the one in Christopher Wren’s cupola at St. Paul’s Cathedral, London. Since the angle of incidence equals the angle of reflection, sound travels around the circular walls of the gallery, and not across the empty space in between. Famously, a whispered sound on one side can be clearly heard – or overheard – by a listener whose ear is near the wall on the opposite side.
The intrigue suggested by overhearing whispers played a role in the ancient caves near Siracusa in Sicily known as the Ear of Dionysius (Orecchio di Dionisio). This limestone cave with a shape reminiscent of an ear produces echoes that bounce around its length. An associated legend is that the caves housed prisoners at one time and the ruler Dionysius was able to eavesdrop on them. As with hidden microphones today, sound seems to have always had a role in surveillance and control.
10. Personal Listening Experiment. On a soundwalk, try to find buildings or walls with parallel surfaces that are at various distances apart. Do you immediately notice the effect of sound bouncing back and forth between the walls? At what width does it become most noticeable? Try clapping your hands or making some other percussive sound.
Transitional spaces are sometimes similar to this configuration, so also notice how the acoustics change when going from a more open space to this semi-enclosed one. You might need to close your eyes (or be guided blindfolded by a friend) so that you can hear the transition better.
Index
C. Reverberation. The cumulative result of all of the reflections in an enclosed space is called reverberation, and is arguably one of the most complex acoustic phenomena we encounter. Every surface, large or small, participates in reflecting sound waves in the space, and as a result the frequency response of the space and all of its components and materials, along with its physical geometry, are mirrored in its unique reverberation. The multiple reflections build up what is called a reverberant field that is comprised of all of the reflections (and reflections of reflections), each with their own frequency colouration added to the original sound.
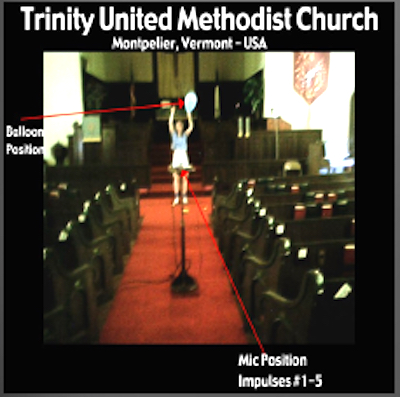
We sometimes try to get a sense of the reverberant field by making a short sound such as a handclap so that we can hear the reverberant response. A more systematic way to do this is to use a standardized broad-band sound with a sudden attack, called an impulse. The reverberant response is called the Impulse Response (IR) which captures both the frequency response of the space and its temporal behaviour, such as how long the reverberation lasts, known as the reverberation time, technically defined as how long it takes the reverb to decay by 60 dB, which essentially means to its disappearance.
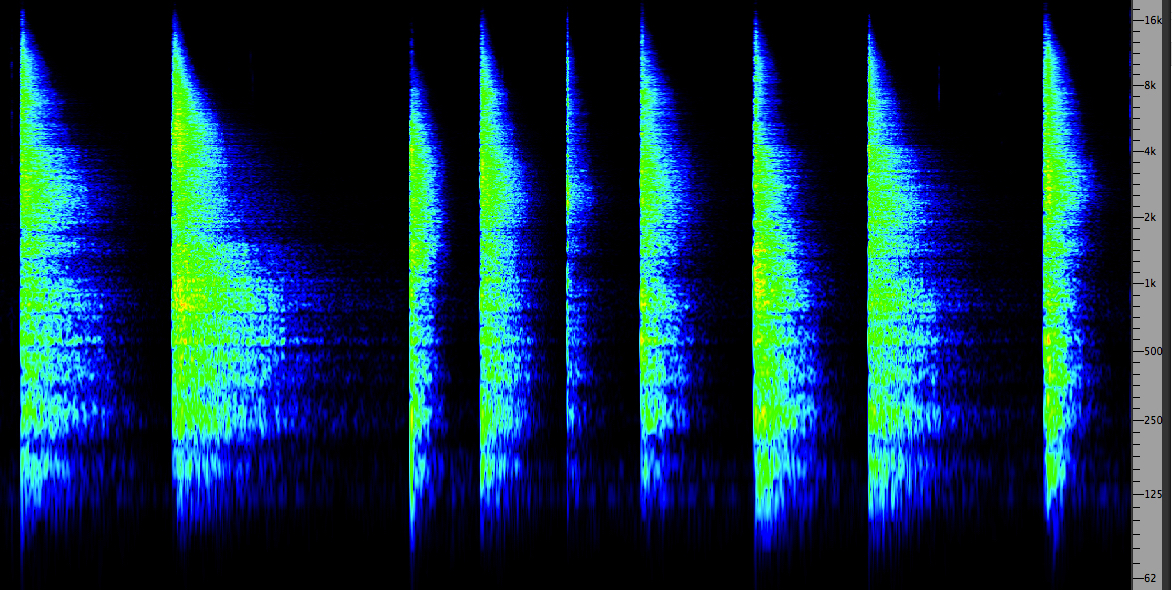
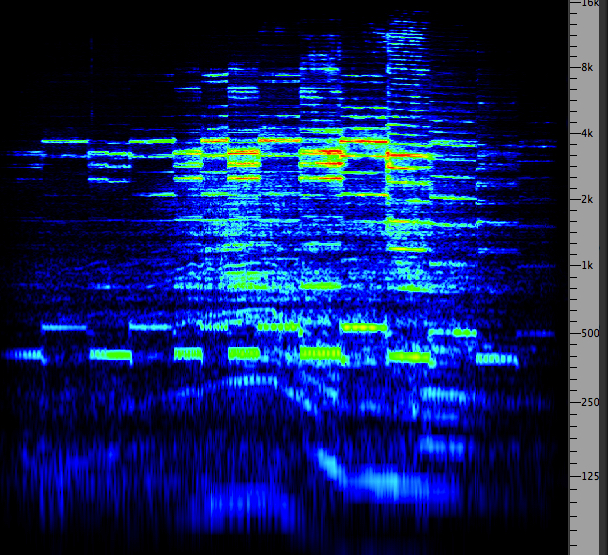
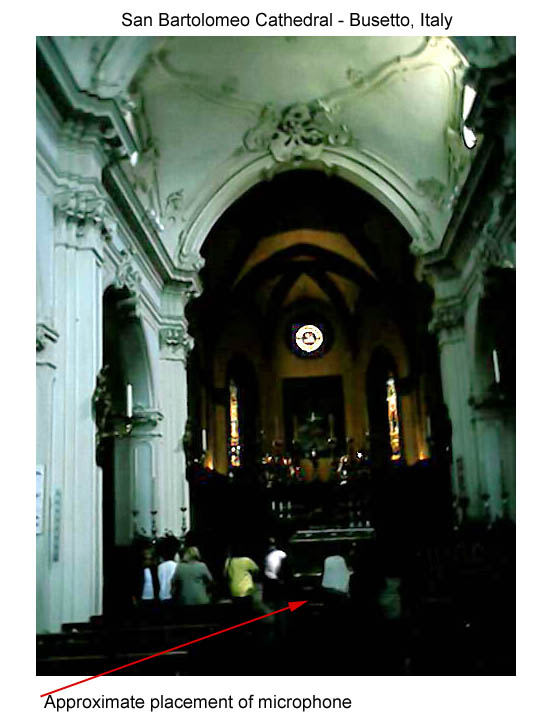
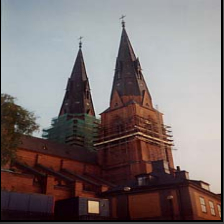
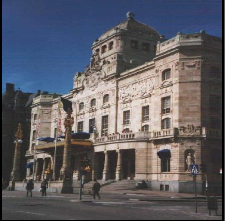
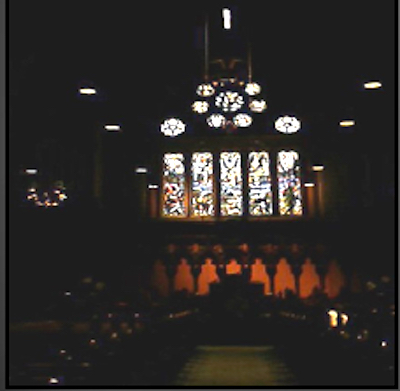
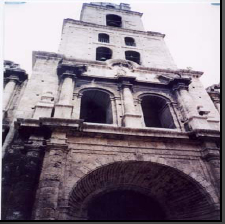
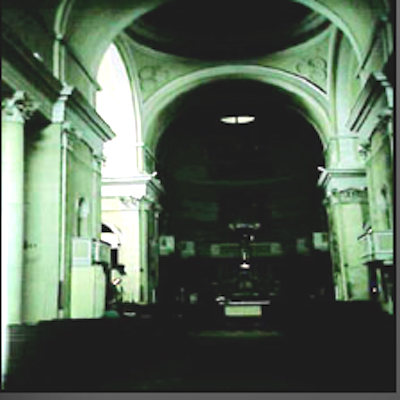
Listening Experiment. Since we seldom get to compare the IR of spaces side by side, it is instructive to hear a group of similar impulse recordings (made by breaking a balloon) inside a variety of large and medium sized spaces. For each of these 12 examples, imagine the size and shape of the space, and try to find adjectives that would describe it.
San Bartolomeo, Busetto, Italy
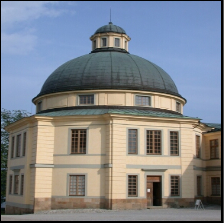
Domkyrkan, Uppsala, Sweden
Royal Drama Theatre, Stockholm, Sweden
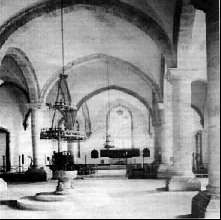
St Nikolai Church
Old South Church, Boston
Temple Church
San Francisco, Havana
Santa Chiara, Italy
Trinity Church, Vermont
Ballroom, Drotningholm, Stockholm
Laukyrkan, Gottland, Sweden
Chamber Room, Gloucester, MA
(Source: WWSS)
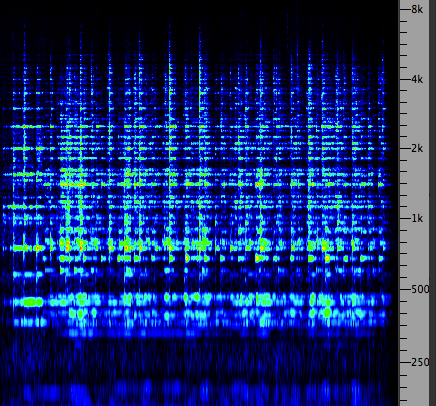
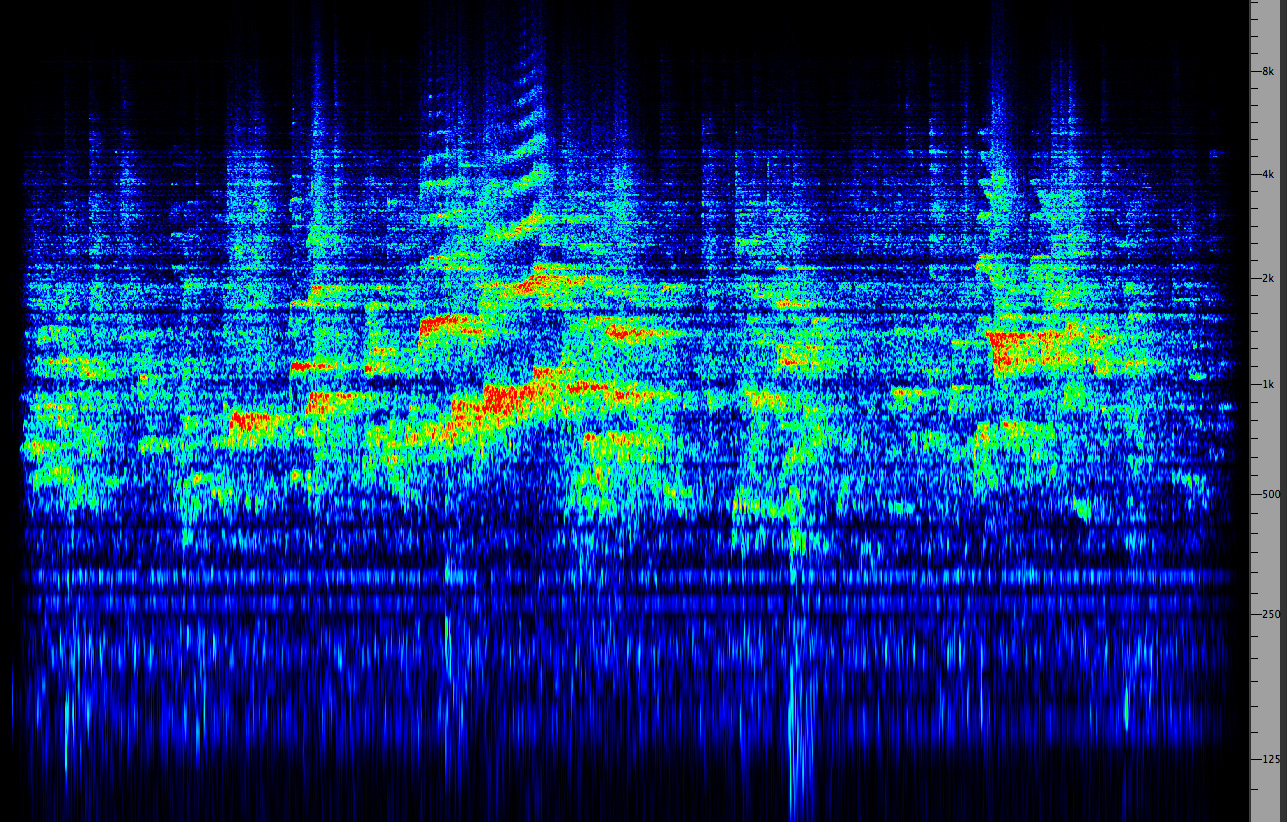
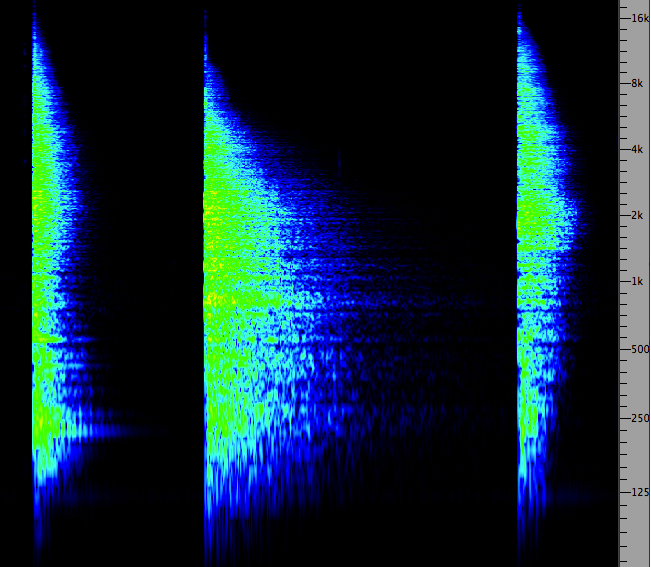
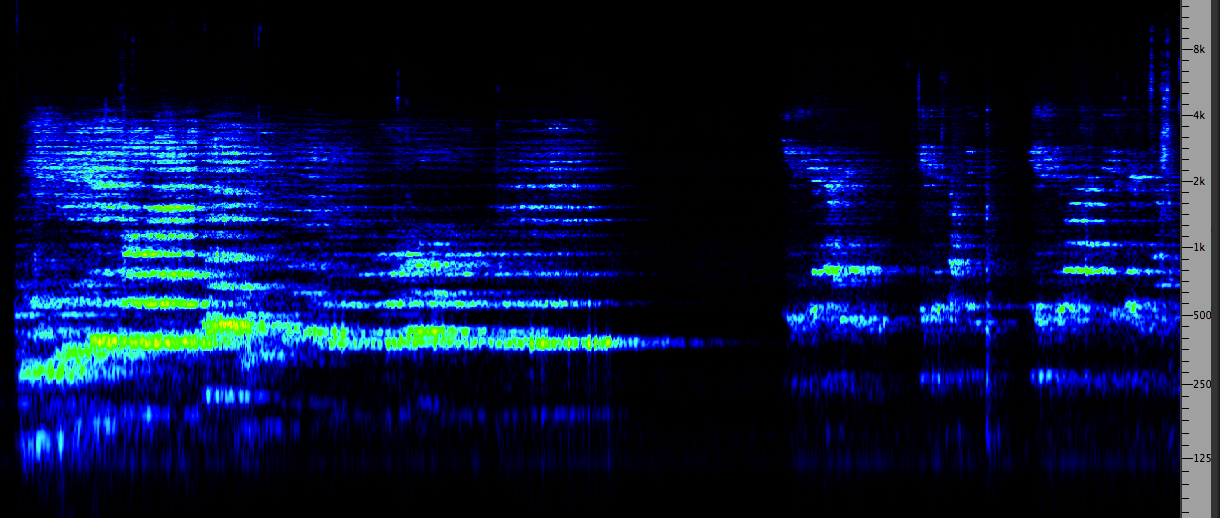
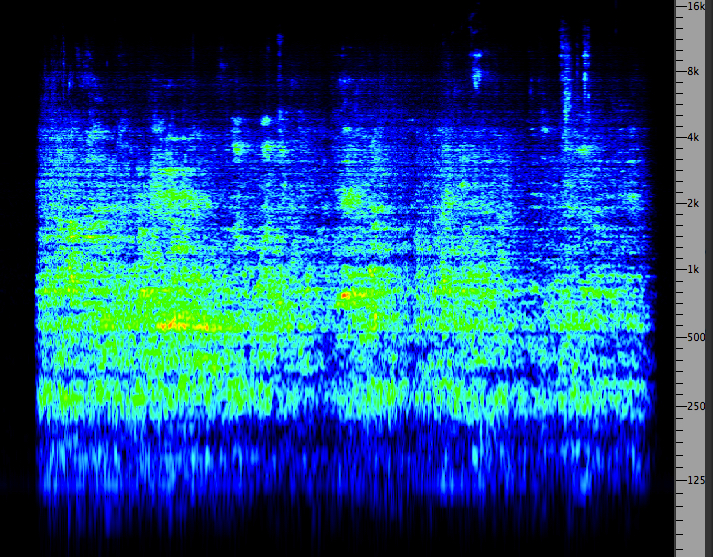
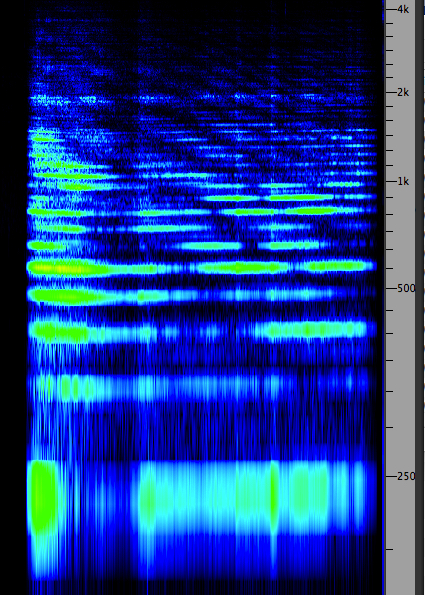
Spectrograms of the 9 impulse responses listed above, left to right, top to bottom.
As you listened to each impulse response, you probably got an instantaneous sense of the space where it was recorded, and could easily hear differences, and not just the ones with very long and very short reverberation times. However, it probably was difficult to put those differences into words, and even harder to visualize the actual spaces (there are links for the ones where we have photos available). There are only a few typical words used to describe reverb, such as “bright” for prominent high frequencies, and “dark” for strong lows, with perhaps “warm” for a good mid-range. However, in general, it is the way that sounds interact with reverberation in a space that is most important. You can listen to some vocal sounds convolved with these IR examples here.
It was only towards the end of the 19th century that reverberation began to be studied acoustically, and the key figure in that regard was Wallace Sabine. In her landmark book, The Soundscape of Modernity, Emily Thompson, an historian of science, not only follows the career of Sabine from his famous study and quantification of reverberation that played an important role in the design of Boston Symphony Hall, which opened in 1900, but she places this development within the context of urban modernity in the early 20th century with the advent of radio and recorded sound, and the rise of urban noise and noise abatement campaigns. She argues that the "failure" of those campaigns in the outdoor soundscape was contrasted with the increasing control of sound via absorbent insulation in indoor environments. The book, and Sabine’s career, ends with the opening of Radio City Music Hall in New York in 1932, which was one of the first to reinforce sound through amplification.
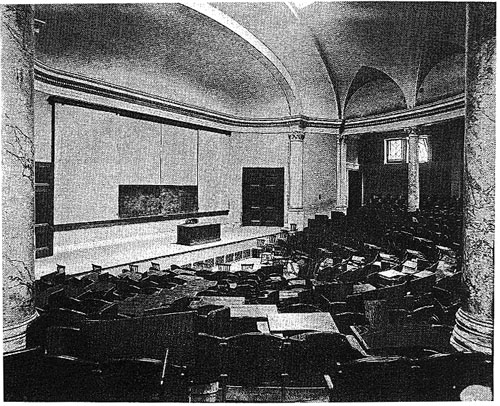
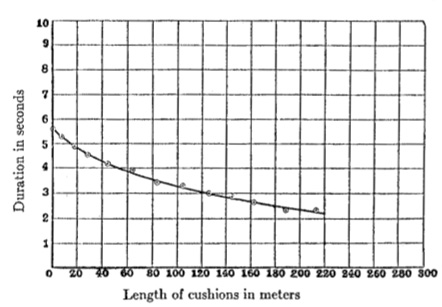
Thompson outlines Sabine’s meticulous measurement of reverberation times (by purely acoustic means, since there was no electrification at that time) in the lecture hall at the Fogg Art Museum whose walls were made of marble, shown at the left below. It seems inconceivable today that the reason why the hall failed acoustically to make lectures intelligible wasn't obvious to everyone, since with a 5.5 reverberation time, it shouldn’t have been a surprise. Besides the innovative way in which Sabine measured reverberation time, was the way he carefully piled up theatre cushions to damp the reverberation until he had about 200 metres of them and measured how the reverberation time diminished, as shown in this historic graph on the right.
Through this research, Sabine was able to formulate an equation which showed that reverberation time varied directly with the volume of the space, and inversely according to the amount of absorption present, as discussed in the next section. That is, reverberation time increased with the volume of space, and decreased with more absorptive material present.
The measurement of absorption, and the engineering of materials designed specifically to dampen reverb, was the key to an applied acoustical industry for sound control. This not only changed the design of auditoria, concert halls and offices, but also radio studios for recording, where the tradition began of having a “dry” acoustic with a great deal of insulation.
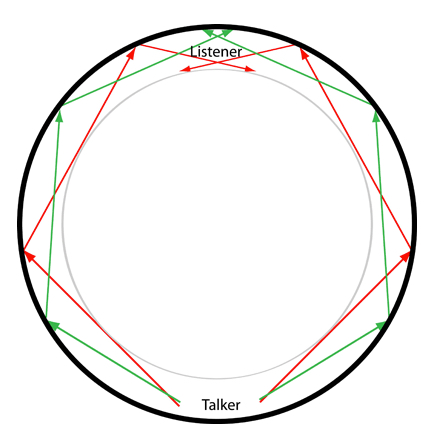
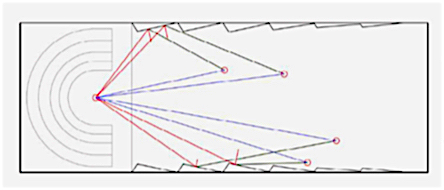
The acoustic design of concert halls is highly complex (and very expensive) because of the large number of variables involved in their construction. The details are beyond our scope, but it is worth considering a classic shape called the shoebox model. For the 200 years in Europe prior to Sabine, concert halls had taken a wide variety of shapes, including circular and elliptical, both of which would have had strong focusing of the sound, as shown above with the concave reflections. However, as acoustic science developed, four classic 19th century concert halls took the basic form of the shoebox, that is a rectangular hall, as shown here. These were Boston Symphony Hall, the Concertgebouw in Amsterdam, the Musikvereinssaal in Vienna, and the Konzerthaus in Berlin.
The key acoustic character of these shoebox halls, besides having a modest volume, is that the parallel walls at the side of the stage provide strong early reflections (red lines) within 80 ms and from approximately a 45° angle, that reinforce the sound for the listener and give it a strong presence. These classic halls can be contrasted with one of the typical modern concert hall models that became popular after World War II, namely a fan shape. Since the walls now had a wide angle to them, early reflections did not occur and sound energy was lost.
Moreover, economic imperatives dictated that such new halls must seat 3,000 or more people (compared with the 1500-2000 seat capacity of the classic shoeboxes), and be used for all types of events with different acoustic needs. The acoustic sound, however, was weak and compared unfavourably with what listeners were becoming used to with high-fidelity stereo recordings at the time, and as a remedy, often such halls started subtly amplifying (i.e. reinforcing) the sound in the case of symphonic music and opera, in spite of the tradition not to.
In recent decades, the shoebox model has come back into favour, along with highly innovative geometries that modify and extend the classic shape, for example the “vineyard model” or alternatives such as the “surround” model of the Philharmonie in Berlin which was influenced by an egalitarian ethic.
Question: if parallel walls are known to bounce sound back forth symmetrically, and therefore are undesirable, why doesn’t that affect the shoebox concert hall negatively? Answer here.
Perception of Reverberation. The main psychoacoustic result of reverberation is to increase the volume of the sound, that is, its perceived magnitude. Most textbooks would say it adds loudness, duration and some kind of spatial impression, but all of these variables are taken into consideration in the term volume, as presented in the Magnitude module.
Reverberation will also blend simultaneous sounds, such as those of a choir or other ensemble, but the amount of reverberation needs to be appropriate to the type of music being performed. On the secular side of things, reverberation can augment all of the random noises in an environment and increase the overall ambient level. Listen to these two examples which possibly have roughly the same level of reverberation. With the choir, note how the male and female voices singing in unison are blended. The amplified female priest, however, needs to speak more slowly to be understood. However, with the marble hallway, voices are amplified and jumbled; such a space would be a nightmare for anyone with hearing loss.
Unison singing, Storkyrkan, Stockholm, and female priest
Source: WSP Eur 4 & 5
(Click to enlarge)
Marble hallway, Parliament Buildings, Ottawa
Source: WSP Can 62 take 4
Reverberation is also a very strong psychoacoustic cue for distance perception. This involves the ratio between the direct (or “dry”) sound and the indirect reverberant (or “wet”) sound. Since the reflected sound energy falls off more slowly because of multiple reflections, its portion of the energy arriving at the ear becomes a larger percentage of what we hear as the source becomes more distant. Likewise, the closer the source, the stronger the direct sound will be.
Listeners are adept at interpreting this cue as distance, and can distinguish, for instance, between a strong sound farther away from a quieter one close by. Here is a subtle example of that, namely a soprano singing in a highly reverberant environment. After the first phrase of the music, she takes two steps back from the microphone, and the slight difference in the reverberant ratio is immediately detected for this change in distance.
Soprano at two distances from the microphone (Source: Catherine Campolin, singing Sonnet to Orpheus by Barry Truax)
The key to achieving a functional balance with sound in reverberant environments might be to consider the relationship between the “space” inside the sound, namely its volume, and the acoustic space into which it is placed. When the latter cannot be changed, then the sound itself must be adapted accordingly.
One of the most extreme cases of the musical use of a diffuse sound field – which would normally be considered as totally inappropriate for a musical performance – is an empty, underground cistern at Fort Worden, Washington, which was used by Pauline Oliveros to record her Deep Listening CD with a small ensemble.
With a reverberation time of nearly 45”, there was a seamless connection of the end of a sound to its reverberant continuation. The musicians clearly needed to play very slowly and with a careful interaction with each other. In other words, the music could not be divorced from the acoustic space, and it is likely that it would not work at all in a dry acoustic space. This approach is essentially the opposite of the standard studio practice of recording each performer in a dry studio space, and mixing them with added artificial “space” later.
Reverberation that is inappropriate in its volume can be regarded as the “enemy” of effective communication, particularly with speech. It is now established (unlike the days of the Fogg Museum lecture hall) that reverberation in a space designed for speech communication should be less than 1 second. The problem is that the reverberant tail of each syllable can mask the next portion of speech, and comprehension drops.
Amplification may seem to help, but often it includes a “boominess” in the lows that is tiring to listen to. Acoustic research in classrooms, for instance, often shows a remarkable lack of awareness on the part of students and others that the poor acoustic design of the classroom is an impediment to speech comprehension and learning, as measured by the Articulation Index.
For those with unimpaired hearing, the main psychoacoustic cue that lets the auditory system separate the direct sound from the reverberated sound, is an ability called precedence effect (which will be studied more closely in the next module) where:
- the direct sound arrives first as a coherent sound wave (since all frequencies travel at the same speed, even if they are coloured along the way) and is likely to be stronger than the reverberant soundHowever, this ability can be overwhelmed in a noisy, higher level ambient situation, or if the reverberant field is too strong, or the distance to the source is too far. In cases where amplification is used, the reproduced sound from a nearby speaker will arrive before the direct sound and possibly be louder, but listeners may not notice that discrepancy of direction unless their eyes are shut!
- the reflected sound arrives later and is uncorrelated because of the random nature of reflections with their various time delays
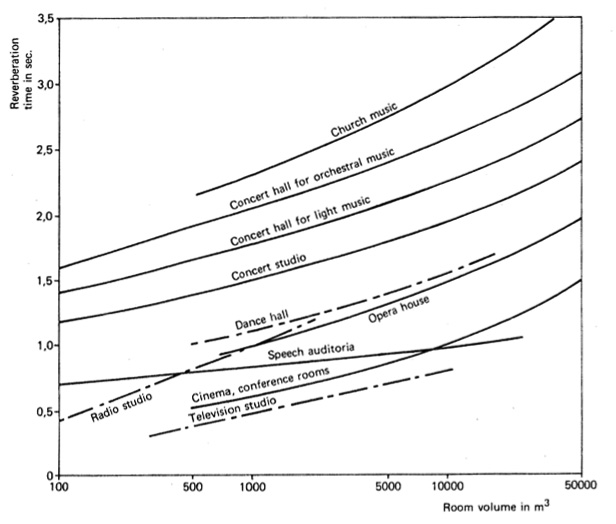
In the design of enclosed spaces for various purposes, there are standard charts like the following to correlate the volume of the space with the optimum reverberation time, according to the type of communication involved.
Reverberation time is along the vertical axis, and the volume of the space on the horizontal. Drier acoustics are placed at the lower end where speech comprehension is the main requirement, including broadcast studios as is their tradition. In all cases, reverberation times less than a second are required for speech. Reverb times between 1 and 2 seconds are desirable for smaller ensembles playing chamber music, where the individual instrumental and vocal lines need to be followed, whereas symphonic music, particularly from the 19th century romantic repertoire, benefits from reverb times longer than 2” for greater fusion and volume. However, more contemporary music with large ensembles may be designed with greater definition to the individual parts, and hence a drier acoustic is preferable.
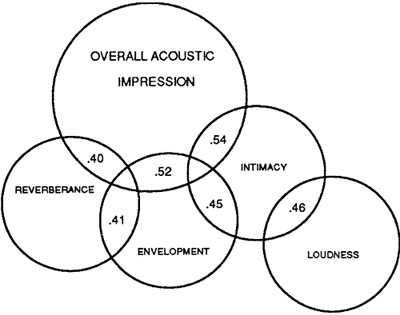
In listening tests involving concert hall acoustics, qualitative evaluations are usually made by test subjects, and then correlated with physical variables that presumably can be implemented. Several factors seem to be related in a typical study, as shown here. The overall acoustic impression has elements of reverberance, the sense of envelopment, and intimacy (which usually refers to definition and clarity and correlates partly with loudness).
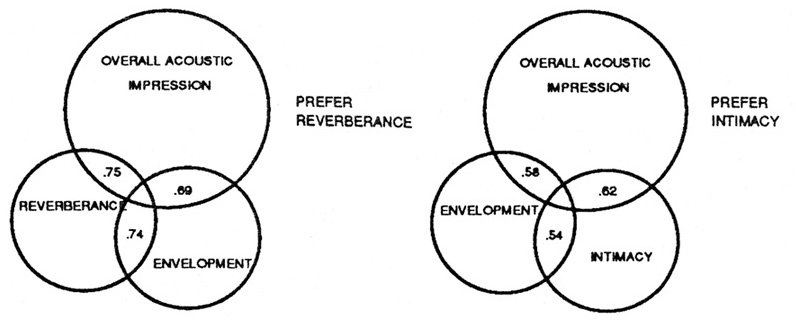
However, there is a trade-off going on between definition (or intimacy) and envelopment. You can’t maximize one without reducing the other, and listener response will tend to divide between two types of preference, reverberance or intimacy. More reverberation increases envelopment, less increases intimacy and definition. Probably these preferences also depend on the type of music being heard, and whether the listening attitude is more analytical (listening for definition) or holistic (immersion in the whole), and these preferences might switch between different pieces of music and different contexts.
Contrasting reverberance preferences (source: Barron)
Historical Example. One final example where these “preferences” were institutionalized occurred during the Protestant Reformation, when the acoustic space of the churches also changed, where possible, to accommodate a different set of beliefs. The Catholic tradition was one of larger reverberant spaces, where the text was in Latin, not the vernacular, and the individual parishioner was theologically bound to go through the priest.
The Lutheran and other Protestant faiths that emerged, preferred using the vernacular language, a spoken word that could be understood by the faithful, and the theological idea of a direct connection to the Deity. This summary of the changes is too simplistic, and in practice, many Protestant congregations initially had to take over existing Catholic churches, but the general trend seems to have been in this direction of smaller, drier acoustic spaces.
There are many types of research today into the acoustic spaces of the past, including non-Western contexts, with analyses based on documentary evidence, and even in some cases, simulations of how they might have sounded. In other words, cultural history can and probably should be linked with its acoustic spaces.
Index
D. Absorption and transmission phenomena. As a sound wave passes through the air, and then when it contacts various surfaces, some of its energy is lost (i.e. dissipated) by being converted to heat. Keep in mind that sound does not much energy compared with other familiar sources, so you are unlikely to be able to feel this effect. The effects in air were presented above in section A.
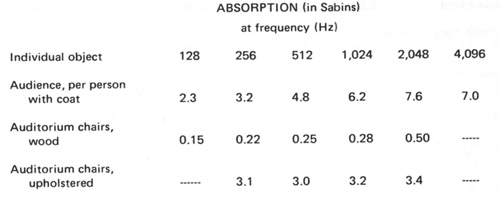
In the previous section we gave a brief history of Wallace Sabine being the first to measure this property in the late 19th century, where his method was to instal hundreds of cushions in a reverberant lecture hall at Harvard, and measure how they reduced the reverberation time. So, instead of a unit of measurement being a cushion (fun but not practical), one of the first types of measurement of absorption (note the spelling with a p, not a b) was given the unit of the Sabin in his honour, as shown in this chart for the amount of absorption at different frequencies.
These absorption values for audience members and the types of chairs present give their values at different frequencies, with the highest amount of absorption being above 1 kHz. The reference to coats and upholstery absorbing more sound energy is because of the porosity of the material. This means that at the micro level, there is more surface area with all of the indentations and air space of an irregular surface. To see how important that is, compare those values to the ones for finished wood chairs where all of that porosity is gone because of the smooth finish that has been applied. If you’ve ever been involved in a rehearsal in a medium to large acoustic space, you’ve probably noticed that the sound was brighter than during a performance with an audience present.
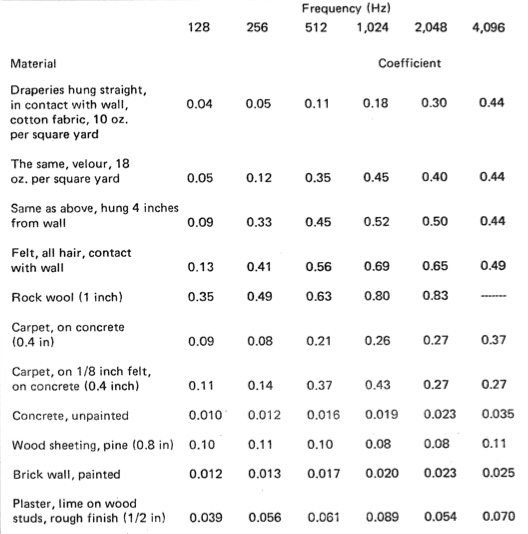
Question: the unit of absorption in the Sabin system is 1 square foot of a “perfect absorber”. What do you suppose that might be? You’ll appreciate the Zen-like answer here.The contemporary version of this measurement is a simple fraction or percentage of the absorbed energy at any given frequency, called the absorption coefficient, and given the Greek letter α (alpha). This makes it comparable to other measurements for insulation in terms of heat loss. Although the following chart is very old, it captures some of the essential characteristics of what makes a good absorber.
Absorption coefficients for common building materials
When we look at these percentages of the amount of energy being absorbed, some common patterns emerge for soundproofing a space:
- high frequencies are always absorbed the most, and there are few substances that can effectively absorb low frequencies; one that is listed above is rock wool, or mineral wool that is used today for heat insulation
- surface area and porosity are the key factors for greater absorption. Drapery, carpets, rugs and upholstery are the most common ways to improve absorption. If you’ve ever experienced an unfurnished room or apartment after you’ve been used to the furnished version, the acoustic difference is striking. All sounds will seem to “echo”, or at least be very reflective. In sound studios, panels with alternating directions of slanted absorbers are often used, as shown below, as they maximize surface area. The traditional “poor student” version of this used to be upside-down egg cartons, at least when they were made of porous cardboard.
- painting surfaces reduces absorption because it covers over most of the porous elements of the surface, hence decreasing its ability to absorb sound; likewise, mirrors and windows are highly reflective, as are most types of varnished flooring, tiles or linoleum
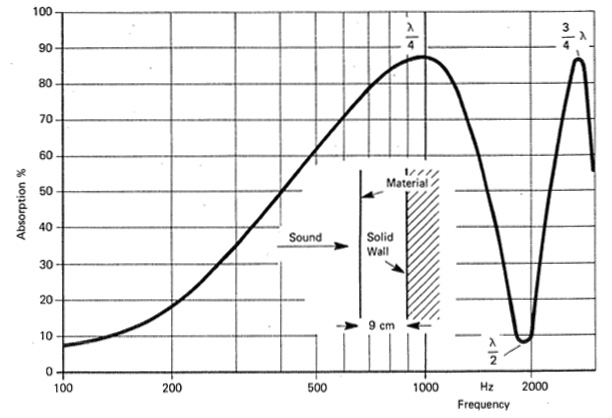
- the reference in the chart to drapery hung a few inches away from a wall, as opposed to being in contact with it, can be explained with the following diagram
There will be substantial cancellation of the sound wave at higher frequencies when the absorbent material is hung a few inches or centimetres in front of the wall, as shown in the above diagram, particularly at the 1/4 and 3/4 wavelength positions, because the reflected wave will be out of phase with the incident wave. Keep in mind that the pressure at a wall is at a maximum (as utilized by PZM – pressure zone – microphones placed there), and therefore the particle velocity is at a minimum. At the 1/4 and 3/4 wavelength distances from the wall, where the particle velocity in the absorber is at a maximum, greater absorption will occur.
Transmission phenomena. Like absorption, transmission through a barrier is largely a matter of structural engineering, but some key aspects of it can be noted. Similar to the absorption coefficient, the Transmission Coefficient is the percentage of the sound energy that is transmitted through a barrier. A system for measuring sound insulation in this regard is called the Sound Transmission Class (STC).
- the mass of a barrier improves reduced transmission, but is often an expensive option (e.g. lead lined walls will do the trick); outdoors, a thick earth berm will be needed
- low frequencies are very difficult to prevent from being transmitted through a barrier, the main reason being that the materials themselves resonate at low frequencies (for example, if you hit a wall, the sound is a low-pitched “thump”); decoupling any source of vibration from the barrier, that is, minimizing physical contact, is required by introducing absorbent material
- impact noise, e.g. footsteps, is more likely to be transmitted through a barrier such as a floor and requires specific building construction design to minimize it
- infrasound (below 20 Hz) is the most difficult of all sound energy to contain or control because it can travel for long distances through the earth and all forms of building material in the form of vibration. One of the most common sources of low frequency vibration are air conditioning units, particularly when placed on top of a building, that is, where the building itself is freest to vibrate. Add an underground parking garage as a perfect resonator for low frequencies, and you have created the ideal conditions for you to feel the entire building vibrating!
Index
E. Complex propagation phenomena. This topic would normally include refraction and diffraction but they have been dealt with above in section A. Here we will consider two other phenomena, environmental phasing and Doppler shift.
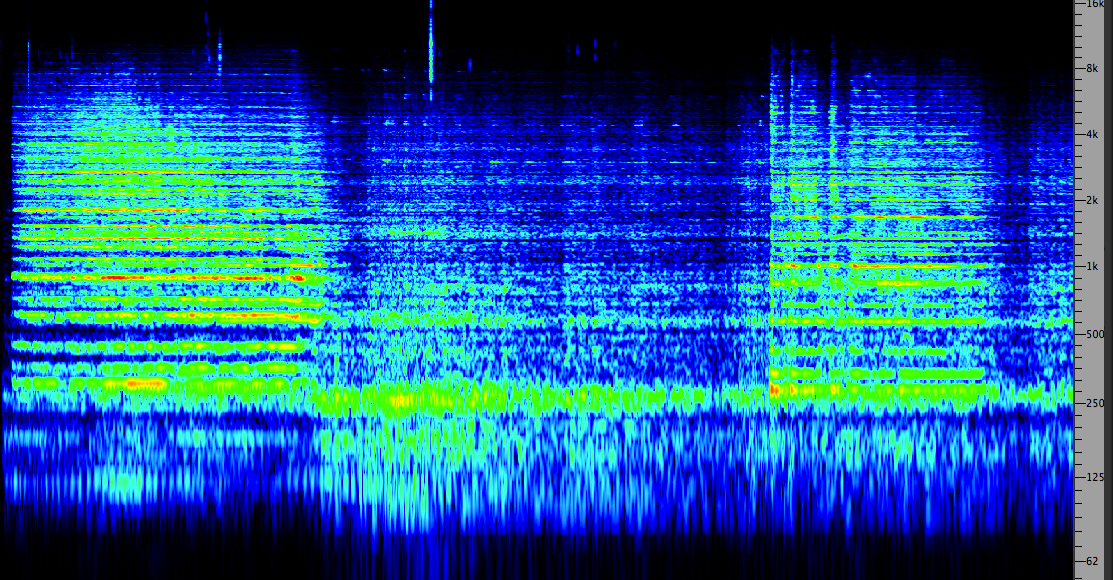
Environmental phasing occurs when there is a strong singular delayed reflection that combines with the original sound wave. A particular set of frequencies in the spectrum will cancel as a result, although in practice, the attenuation is about 20 dB maximum depending on the strength of the reflected sound. The frequencies that cancel are the odd harmonics, and therefore the spectrum is striated with narrow bands in it being diminished.
This effect can be heard here with a seaplane coming in to land in Vancouver harbour where the reflection comes off the water, which is almost a perfect reflector. Because it is a broadband sound and there’s motion involved that lengthens the delays (hence the descending frequencies that are cancelled), the effect is easy to hear.
Seaplane Vancouver harbour
or watch a video version of the spectrogram here
Source: WSP Van 115 take 2
The theory behind this phenomenon is important in electroacoustic processing, and so if you would like to have the complete explanation, with diagrams, jump to this topic in the electroacoustic section – but please return to this point and continue the section here.
Also, you can try this Listening Experiment for environmental phasing with reflections off of a large wall, and this Listening Experiment for phasing with a fountain.
Doppler shift. Because environmental phasing is most noticeable with moving broadband sounds, it is often confused with Doppler shift, also known as the Doppler effect. However, Doppler shift involves a change in perceived pitch due to the movement of an object past you (or your own movement past it). In the seaplane example above, any Doppler shift would affect the low pitch of the motor, whereas what you heard was a dynamic change in the spectrum above it.
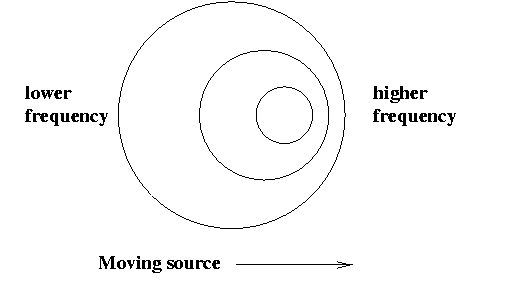
The change in pitch is a function of the difference in relative velocity of observer and source. As the source and observer move closer, the sound waves may be thought of as being compressed together, and therefore, because the wavelength λ decreases, the apparent pitch rises.
Similarly, as the source and observer move apart, the waves are expanded and the increased wavelength corresponds to a drop in pitch. This diagram shows how the waves are compressed coming towards you on the right side. If it is moving away, then the diagram would be inverted showing the lengthened waves.
The observed frequency fo may be calculated from the relation:fo = fs . (v - vo) / (v - vs)
where: v is the velocity of the sound in the medium (see speed of sound)
The effect is clearest when the moving source, such as a car or train, is coming towards you at a constant speed (and a similar effect can be observed when you are on the train approaching a railway crossing signal). A common misconception is that the pitch is descending as it approaches – no, if the movement is at a constant speed, the pitch is merely higher as the sound waves compress in front of the car or train.vo is the velocity of the observer relative to the medium
vs is the velocity of the source relative to the medium
Similarly, as it recedes, again at a constant speed, the pitch switches to being lower by the same amount. What is most dramatic and can be imitated by any schoolchild mimicking a motorcycle for instance is the sudden drop in pitch exactly as it passes the listener.
The equation, then, predicts that at a speed of 42 mph (67 km/hr) the pitch will be a semitone higher (about a 6% shift) as it approaches and a semitone lower as it recedes, for a full whole tone apart in total. Given our sensitivity to pitch changes, this is dramatic, and a much smaller interval can be determined at slower speeds.
In Europe where most emergency vehicles are two toned, the musical interval between the notes gets quite distorted during a Doppler shift, as can be heard in this example, although since the movement is not straight towards the recordist, the effect will appear more variable. Here are three examples for different vehicles.
Passing train, note the before and after pitch change
Source: WSP Can 54 take 6
Motorcycles racing
Source: WSP Van 15 take 1
Fire siren moving in the streets, Stuttgart
Source: WSP Eur 13 take 6
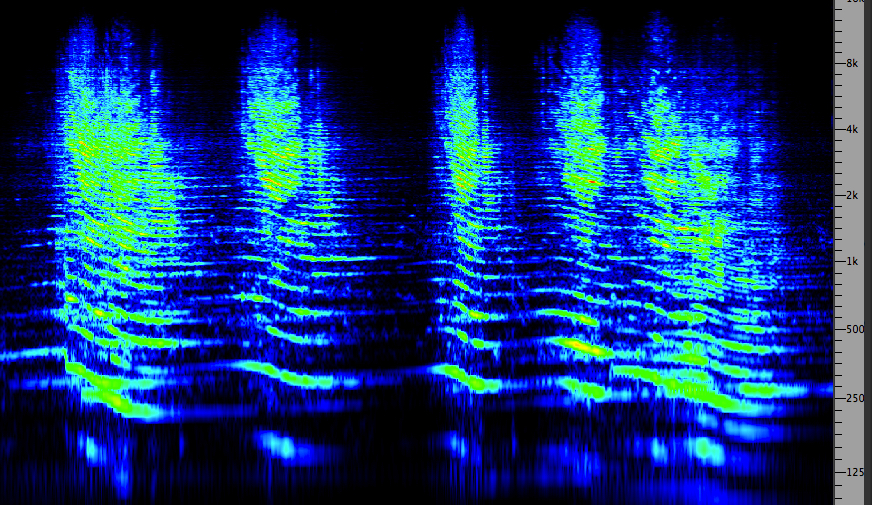
In the motorcycle example, as revealed in the spectrogram, there is environmental phasing going on as well as the characteristic Doppler shift.
In the case of acceleration, then the pitch shift can become a glissando, i.e. a continuous pitch drop or ascent. This could happen with a vertical dropping object, for instance, as it accelerates away from you, or (watch out) as it approaches!
Another more complex situation is where you are not beside the path of travel, for instance, but at right angles to it at some distance and the car or train is passing left to right in front of you at a distance. A similar shift can be experienced, but much less dramatically because of the increased angle. However, this situation can become even more complex if there is also an echo off a mountain, for instance, so its angle of arrival (and therefore pitch) will seem different again.
The limiting case of Doppler shift occurs when the moving vehicle, in this case a jet airplane, moves faster than the speed of sound (ca. 740 mph). The wavefronts bunch up so closely that the plane “breaks the sound barrier” and produces a huge sonic boom, and effect that can be highly destructive.
As interesting as the Doppler shift is for sound, and how it symbolizes speed and movement, the astronomical equivalent is better known. The light from distant galaxies can be analyzed for its spectrum shift, and because that is towards the red end of the spectrum, it proves that these galaxies are moving away from us, as discovered by Edwin Hubble and his mainly female colleagues in the early 20th century.
Historical interlude. The effect is named after its discoverer, Christian Doppler, a 19th century Austrian physicist. It is possible that the effect was first noticed with the advent of trains in Europe. In 1845, an experiment was carried out near the Dutch town of Maarsen where musically trained observers were stationed along the tracks of the Rhine Railroad and listened to trumpets being played in a passing railway car. By noting the pitch of the approaching and receding notes, the speed of the train was accurately estimated.
So, there we have an excellent example of the difference between light and sound waves – the Doppler effect in sound tells us of the terrestrial motion of trains that we can hear, and the visual equivalent makes us think of distant galaxies at distances we can barely imagine.
Index
F. Resonance, eigentones and standing waves. First we should clearly distinguish the effects of room resonances from reverberation, with which they are frequently confused. There is good reason for such mistakes, because both types of process prolong and strengthen sound in an enclosed space, but the essential difference is:
resonance is dominant in small to medium-sized spaces, whereas reverberation is dominant in large spaces
resonance is caused by the amplification of specific frequencies, whereas reverberation is caused by reflected sound
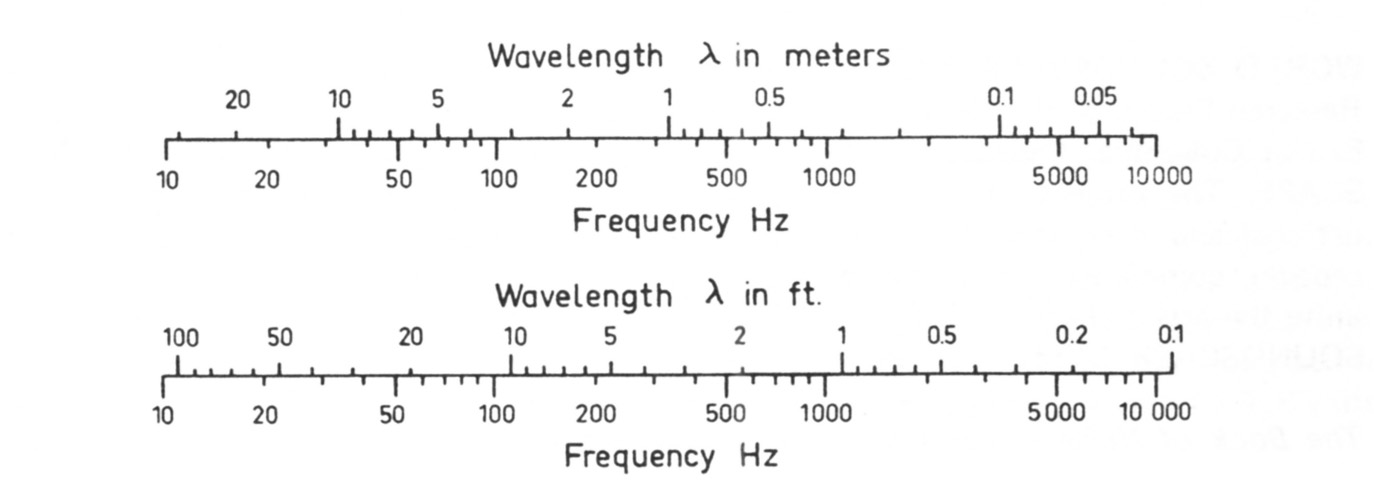
The exact dividing line between the effects is blurred, but the key difference lies in the wavelengths of frequencies that will resonate in a space. We’ll start by revisiting the table of wavelengths. Here we can see that a 100 Hz wave has a 10’ wavelength λ and a 50 Hz wave has a 20’ wavelength. These are starting to look like the dimensions of a small room.
You may recall that the resonant modes of a string fixed at both ends are a set of harmonics whose fundamental is a half wavelength that equals the length of the string. So what is the equivalent in terms of a space that is closed at both ends? Well, it’s a room, except that unless it’s a perfect cube, it will have three dimensions, length, width and height, that must be considered.
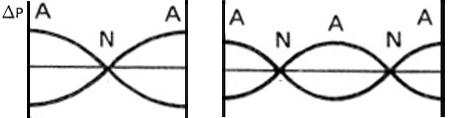
First and second harmonic eigentones
This diagram shows the 1st and second harmonics that “fit” the dimension of a room. It looks different from a string because there is maximum pressure (as in the diagram) when the wave reflects from the wall. But the fundamental mode is still 1/2 wavelength, and for the second harmonic it’s a full wavelength, and so on for higher modes. These modes of vibration are usually referred to as eigentones, from the German meaning the “tones belonging” to the room. So, every room has 3 fundamental eigentones and all of their harmonics.
Also recall that the points of minimum pressure, the nodes marked N, are fixed in space, as are the maximum pressure points, called antinodes marked A. Since these positions are fixed, eigentones are created by standing waves, so called because there is no net propagation. The wave in one direction is balanced by its opposite in the reverse direction.
In a rectangular room, then, there are 3 fundamental modes corresponding to the half wavelengths for length, width and height, plus their harmonics. It’s possible to have a secondary set that “fits” in the diagonal between a lower corner and the opposite upper corner, but these can be neglected. That means there is a complex interplay between the eigentones in the three dimensions of the space.
The nodes will be experienced as dead spots (i.e. minimum pressure) and the antinodes as “hot spots” (i.e. maximum pressure). Having a constant pressure on your ears is not very pleasant if the pressure is fairly high, so finding a dead spot, despite the name, is rather a relief!
Question. George likes to sing in the shower, even though he doesn’t regard himself as a good singer. But when asked, he simply says his voice sounds better there. Why do you think that is the case? Answer here.If a room has a 20’ dimension, then that will correspond to the 2nd harmonic of a 50 Hz eigentone which will be quite strong. And if it is 10’ high, then that is the 2nd harmonic of a 100 Hz eigentone. However, once the dimensions are larger than about 30’ (10 m), these resonant modes will be less important that reverberation.
11. Personal listening experiment. Go with a friend or two to a small enclosed space such as a stairwell and pause on the landing area of one floor. Start humming some pitches and find the one that is loudest in that space. That is one eigentone, but there will be others, some higher and some lower. Move around the space (including up and down) and feel the vibration of the standing wave that you and the space are creating. If you and your friends are humming the same pitch, can you tell which is your sound? Also try to find an octave above your note. Try to move into a dead spot and keep humming.Clearly this situation is the opposite of good diffusion, i.e. an even spread of sound energy in an enclosed space. It’s actually the opposite, a complex mix of high and low pressure positions that are the resonant amplification of specific pitches.
In a more normal room, with dimensions in the 10-20 ft (3 to 6 m) range, you can see that the low frequencies are going to be resonated via the eigentones. That is why male voices sound boomier in those rooms, compared with outdoor situation where are less likely to have any specific resonances. Female voices will be resonated as well, depending on their pitch range, but the higher eigentones are usually weaker. You can hear this difference in the sound example above with the voice moving between indoor and outdoor spaces.
As the dimensions of a space get larger, the resonant modes get lower and lower, and eventually they will have little effect on the sound, and the reverberant field will mainly determine the result.
As a final example, let me introduce you to the ancient Hindu temple complex known as the Prambanan, a World Heritage site situated just outside Yogyakarta in Indonesia. As you can see from the photo, it consists of a large number of self-similar temples, the largest one dedicated to Shiva. In the smaller ones, the circular interior room is the right size to produce prominent eigentones in the vocal range.
Tourists usually pop their heads in, and immediately leave, saying “nothing here” which is true visually, but aurally these rooms seem to have been designed for chanting since the resonant frequencies strongly enhance the voice. However, the most remarkable aspect is the conical dome above the room. Its proportions seem to be specially designed to resonate to the upper harmonics of the room resonances, and much more strongly than what would experience in a more conventional space.
If you’ve had an experience humming tones in a stairwell or other small resonant space, as suggested above, you may have noticed that when the sound in your body matches the immersive sound of the resonant space, the boundary between the two seems to disappear, at least aurally. One wonder whether over the centuries that such spaces like the Prambanan have existed, whether this liminal experience based on a particular acoustic phenomenon has played a role in spiritual practices.
Index
Q. Try this review quiz to test your comprehension of the above material, and perhaps to clarify some distinctions you may have missed.
home
