 
Home || Political Parties || Polling Data || Ridings || Marginal Seats || Women & Elections || Election Laws || Links 2008 Canadian Election Results
|
||||||||||||||||||||||||||||||||||||||||||||||||||||||||||||||||||||||||||||||||||||||||||||||||||||||||||||||||||||||||||||||||||||||||||||||||||||||||||||||||||||||||||||||||||||||||||||||||||||||||||||||||||||||||||||||||||||||||||||||||||||||||||||||||||||||||||||||||||||||||||||||||||||||||||||||||||||||||||||||||||||||||||||||||||||||||||||||||||||||||||||||||||||||||||||||||||||||||||||||||||||||||||||||||||||||||||||||||||||||||||||||||||||||||
 |
 |
Note: These results include the judicial recount in Brossard - La Prairie (QC) which declared the Liberal candidate the winner instead of the Bloc Quebecois who had been declared elected on election night.
2008 Canadian Election Results by Province
|
|||||||
|
Region
% Turnout |
|
|
Other | Total | |||
47.7 |
16.6% |
1.7% |
46.8% |
33.7% |
1.3 |
||
69.0 |
36.2 |
4.7 |
47.7 |
9.8 |
1.7- |
||
60.3 |
26.1 |
8..0 |
29.8 |
28.9 |
6.6 |
||
62.9 |
39.4 |
6.1 |
32.5 |
21.9 |
0.2 |
||
61.7 |
38.1 |
21.7 |
3.5 |
23.7 |
12.1 |
0.8 |
|
58.6 |
39.2 |
8.0 |
33.8 |
18.2 |
0.9 |
||
56.1 |
48.9 |
6.8 |
19.1 |
24.0 |
1.2 |
||
58.7 |
53.8 |
5.6 |
14.9 |
25.5 |
0.2 |
||
52.4 |
64.7 |
8.8 |
11.4 |
12.7 |
2.6 |
||
60.1 |
44.5 |
9..4 |
19.3 |
26.1 |
0.8 |
||
47.7 |
37.6 |
5.5 |
13.6 |
41.4 |
1.8 |
||
47.4 |
34.9 |
8.3 |
29.1 |
27.6 |
- |
||
63.2 |
32.7 |
12.8 |
45.8 |
8.7 |
- |
||
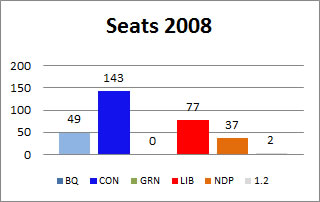
| 2008 Total |
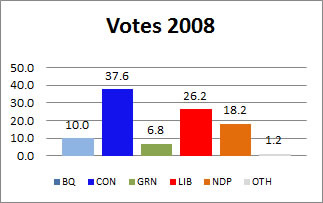
49 10.0 |
143 37.6 |
- 6.8 |
77 26.2 |
37 18.2 |
2 1.2 |
308 |
| 2006 Total |
51 10.5 |
124 36.3 |
- 4.5 |
103 30.2 |
29 17.5 |
1 1.0 |
308 |
Download the election results in an Excel spreadsheet! This file also contains coding for incumbency and gender of the candidates.
The 2008 election appears to have been a real success for the Conservative Party with a gain of 19 seats from the 2006 election. However, that success was entirely due to the woes of other parties, rather than any added support for the Conservatives. Indeed the number of Canadians voting for the Conservatives even dipped slightly.
Votes Won: 2008 v. 2006 |
||||||||||
| Votes 2008 |
|
|
|
|
|
|||||
| Votes 2006 |
|
|
|
|
|
|||||
| Difference |
|
|
|
|
|
|||||
Note: These are the final validated results, including judicial recount. Source: Elections Canada, 2008 and 2006
The main factor in Conservative success was acutally a big drop in turnout among Liberal supporters. While the Green Party managed to split the Conservative's opposition by capturing a number of defecting Liberals and NDPers, the Conservatives benefited even more from the hundreds of thousands of disenchanted Liberals who simply stayed home on election day. The Conservatives picked up 11 seats in Ontario with an impressive gain in popular vote from 35 to 48%. However, the Conservatives won hardly any more votes in Ontario compared to 2006. Their gain in vote share came about because 500,000 Ontario voters went AWOL between the two elections, most of them Liberal, leaving the Conservative candidates better supported in comparison. The Conservatives were not able to capitalize on the drop in Bloc support across Quebec, because they received 120,000 fewer votes in that province themselves. The only province where the Conservatives made many gains thanks to a substantial increase in votes was British Columbia.
One winner in the 2008 election appears to be the Green Party, which is the only party to have increased its actual number of votes in the face of a large decline in turnout. Green votes grew by a substantial 273,545. Of course, that growth in support did not result in a single Green candidate's election.
A bright spot in this election is the record number of women who have been elected to the House of Commons. The 68 women elected comprise 22.1% of current MPs, which marks a record for both the number of women and their proportion of the overall House. You can read more about this on the women in elections page of this site.
You can compare the 2008 results with the party standings at dissolution, and the 2006 election results; for interest sake, you can also look up election results dating back to 1867. The Atlas of Canada project at Natural Resources Canada provides excellent maps of election results from 2000 to 2008.
The following table shows the spread of support for each party's candidates. Realistically, a party is more likley to pick up seats in the next election in ridings where it won at least 30% of the vote in 2008. From this table, it would appear that the BQ have the least room to grow, having already won 49 of the 54 ridings where they earned more than 30% of the vote. The Conservatives are the best positioned for the next election, having received more than 30% of the vote in 197 constituencies (143 of which they won in 2008). The Liberals have some room to grow, having won 77 of the 113 ridings where they garnered more than 30% of the vote; they would, however, need a fundamental shift in voter support to try to match the number of seats won by the Conservatives. In a relative sense, but on a smaller scale, the NDP are well positioned with 37 victories out of the 54 ridings in which they were competitive.
Number of Candidates Winning % of the Vote |
||||||
| Political Affiliation | 0-9.9 |
10-19.9 |
20-29.9 |
30-39.9 |
40+ |
Total |
| Animal Alliance Environment Voters | 4 |
0 |
0 |
0 |
0 |
4 |
| Bloc Québécois | 4 |
5 |
12 |
16 |
38 |
75 |
| Canadian Action Party | 20 |
0 |
0 |
0 |
0 |
20 |
| Christian Heritage Party | 59 |
0 |
0 |
0 |
0 |
59 |
| Communist Party | 24 |
0 |
0 |
0 |
0 |
24 |
| Conservative Party | 7 |
54 |
49 |
63 |
134 |
307 |
| First Peoples National Party | 6 |
0 |
0 |
0 |
0 |
6 |
| Green Party | 262 |
38 |
2 |
1 |
0 |
303 |
| Liberal Party of Canada | 36 |
88 |
68 |
46 |
69 |
307 |
| Libertarian Party | 26 |
0 |
0 |
0 |
0 |
26 |
| Marijuana Part | 8 |
0 |
0 |
0 |
0 |
8 |
| Marxist-Leninist Party | 59 |
0 |
0 |
0 |
0 |
59 |
| New Democratic Party | 65 |
161 |
28 |
21 |
33 |
308 |
| Newfoundland and Labrador First | 3 |
0 |
0 |
0 |
0 |
3 |
| People's Political Power Party | 2 |
0 |
0 |
0 |
0 |
2 |
| Progressive Canadian Party | 10 |
0 |
0 |
0 |
0 |
10 |
| Western Block Party | 1 |
0 |
0 |
0 |
0 |
1 |
| Work Less Party | 1 |
0 |
0 |
0 |
0 |
1 |
| neorhino.ca | 7 |
0 |
0 |
0 |
0 |
7 |
| Independent | 63 |
1 |
0 |
2 |
1 |
67 |
| No Affiliation | 3 |
1 |
0 |
0 |
0 |
4 |
Source: Elections Canada
2008 Election Trivia - Based on the Preliminary Results
Only 25 out of the 308 winning candidates in the 2008 election were elected with a majority of the votes cast in their ridings. 41 of the winners were elected with less than 40% of the vote.
15 candidates were elected with less than 1% difference in votes between 1st and second place in thief ridings. However, none qualified for an automatic recount, which requires less than 0.1% difference.
The lowest number of votes between 1st and 2nd place was found in the BC riding of Vancouver South, where Liberal Ujjal Dosanjh beat Conservative Wai Young by 22 votes after a judicial recount.
Richard Nadeau, BQ candidate in Gatineau earned the distinction of the candidate elected with the lowest share of the votes cast in the riding, 29.1%. Conservative Kevin Sorenson in Crowfoot, Alberta was elected with the highest share of the voters, at 82.0%.
The electoral district with the lowest turnout in 2008 was Fort McMurray-Athabasca (AB), with only 35.9% of registered voters bothering to venture to the polls. At the other end of the spectrum is Malpeque (PEI), where 72.3% turned out to vote.
2008 Canadian Election Seat Predictions |
||||||
| OTH | ||||||
| DemocraticSpace.com | 52 | 128 | 0 | 92 | 34 | 2 |
| Ekos | 51 | 136 | 0 | 84 | 35 | 2 |
| ElectionPrediction.org | 51 | 125 | 0 | 94 | 36 | 2 |
| Laurier Institute of Public Policy | 51 | 135 | 0 | 87 | 33 | 2 |
| UBC Election Stock Market | 49 | 131 | 0 | 88 | 38 | 2 |
| Actual Seats 2008 | 49 | 143 | 0 | 77 | 37 | 2 |
|
Most Recent Opinion Polls Prior to 2008 Election
You can look up detailed national or provincial polling results for the whole campaign period. |
||||||
| Link to Poll | Polling Data |
|
|
|
|
|
| Ekos | Oct 11-13 n=2358 error= +/- 2.0% |
10 | 35 | 10 | 26 | 19 |
| Nanos | Oct 10-12 n=1269 error= +/- 2.8% |
10 | 34 | 8 | 27 | 21 |
| Harris/Decima | Oct 9-12 n=1256 error= +/- 2.8 % |
11 | 34 | 9 | 25 | 19 |
| Angus Reid
on-line poll |
Oct 9-12 n=1039 error= +/- 3.0 % |
9 | 37 | 7 | 27 | 20 |
| Strategic Counsel | Oct 11 n=1000 error= +/- 3.1 % |
9 | 33 | 11 | 28 | 18 |
| Actual % Vote | 2008 Election | 10 | 38 | 7 | 26 | 18 |
Counting ballots and verifying results
On election night, the ballot papers are counted one at a time. When all the ballots are counted for one polling station, the results are submitted electronically to Elections Canada. These are broadcast to the public as they come in. When all the ballots are counted on election night, these totals are known as the "preliminary results". Over the next seven days the process of verifying the results occurs. In each riding, the totals for every polling stations are checked and added up once more, before being submitted to Elections Canada; these are known as the "verified results."
In very close contests, recounts of each ballot paper can be undertaken. Judicial recounts are mandatory in ridings where the winning margin is less than 0.1% of the total valid votes cast. For example, in a riding where 100,000 valid votes were counted, a judicial recount will be held if the winning margin is less than 100 votes; for more information, consult the Elections Canada fact sheet on what happens after electors vote or the Manual on Judicial Recounts. Recounts can also be requested by anyone who asserts that ballots were improperly counted or rejected. The period in which recounts are held can take a few days or weeks to complete. When all the judicial recounts are completed and the final appeals are disposed of, Elections Canada issues the "official results"; these results are usually published 2 or 3 months after election day.
2008 Recounts:
Brampton West (ON): Validated Results - Andrew Kania (LIB) 21,739 defeated Kyle Seeback (CON) 21,516, the difference is 223 votes or 0.41%. Recount requested by Seeback. Judicial recount: Kania confirmed as winner, 21,746 to 21,515 votes
Brossard - La Prairie (QC): Validated Results - Marcel Lussier (BQ) 19,202 defeated Alexandra Mendes (LIB) 19,100; the difference is 102 votes or 0.17%. Recount requested by Mendes. Judicial recount: Mendes defeated Lussier, by 19,103 to 19,034 votes.
Egmont (PEI): Validated results - Gail Shea (CON) 8,122 defeated Kerith MIlligan (LIB) 8,060; the difference is 62 votes or 0.34%. Recount requested by Milligan. Judicial recount: Shea confirmed as winner, 8,110 votes to 8,055.
Esquimalt–Juan de Fuca (BC): Validated Results - Keith Martin (LIB) 20,042 defeated Troy DeSouza (CON) 19,974; the difference is 68 votes or 0.12%. Recount requested by DeSouza.Judicial recount: Terminated at request of DeSouza.
Kitchner-Waterloo (ON): Validated results - Peter Braid (CON) 21851 votes defeated Andrew Telegdi (LIB) 21803; the difference is 48 votes or 0.08%. Automatic recount ordered. Judicial recount: Braid confirmed as winner, 21,830 votes to 21,813.
Vancouver South (BC): Validated results - Ujjal Dosanjh (LIB) 16,101 defeated Wai Young (CON) 16,068; the difference is 33 votes of 0.08%. Automatic recount ordered. Judicial recount: Dosanjh intially confirmed as winner, by 22 votes. Young appealed this for a further recount. The second recount confirmed Dosanjh as winner, 16,110 to 16,090.
You can also get detailed election results from several online sources:
- Elections Canada
- CBC
- Cyberpresse.ca en français
- CTV
- Globe & Mail