- IAT 802 Info About & Contact
- Week 1 Intro & Big Picture
- Week 2 Scientific Res. Methods
- Week 3 Ethics & Hypotheses testing.
- Week 4 What to Measure? How?
- Week 5 Experimental Design
- Week 6 Exp. Design cont'd
- Week 7 Research Proposals
- Week 8 Presenting Research
- Week 9 Doing Your Own Research
- Week 10 ...
- Week 11 What does your data tell?
- Week 12 Iron Stats &Presentation
- Week 13 Communicating Research
- Week 14 ...
General Information
About IAT 802 Quantitative Research Methods and Design
or the Craft of Scientific Research
Note: this is the former and out-dated website from the 2013 course offering. Please see iSpaceLab.com/Riecke/Teaching/#802 for the latest course offerings and information
Course Description & Motivation
Your education, research, and thesis work at SIAT (and beyond) requires you to engage in various forms of doing and communicating research. Moreover, your success at SIAT and beyond will in part be evaluated based on the quality of your own research and communication thereof.
The overarching goal of this course is to help you develop the knowledge & skills essential for conducting proper scientific and quantitative research, as well as critically analyzing, discussing, and communicating it. In sum, IAT 802 is an introduction to experimental design and research methodologies where quantitative approaches are appropriate. There will be particular focus on research design for HCI and the sciences.
Details and further information can be found in the course syllabus available on Canvas.
Course Objectives, Learning Goals & Outcomes
The course structure and teaching/learning activities are designed around the following questions. That is, by actively participating in this course, student should be able to effectively address the following questions and perform the respective tasks:
1) What is science, the “scientific method” and quantitative research? How do you think and argue like a good scientist?
2) Why do science? What is scientific & quantitative research useful for?
a) Why could you be excited about science? What drives and excites a researcher?
b) What are advantages and disadvantages of quantitative & scientific research methods (as compared to other methods)? That is, what are they appropriate and useful for?
3) What to research? Why research something?
a) How to devise effective research questions and hypotheses?
b) How to effectively motivate research questions?
4) How to use quantitative & scientific methods properly, carefully & effectively?
a) Experimental design: How to design an effective experiment? What does effective
mean?
b) Descriptive statistics: How to present data effectively? What does effective mean?
c) Inferential statistics: What can you conclude from quantitative data? Why? What are your chances of being wrong? How do you decide which statistical methods to use? How to apply them properly? How to do this in a given statistical analysis software (JMP, R, ...)?
5) How to communicate all that effectively and scholarly?
6) How to critically evaluate and discuss the quality of quantitative / scientific research (of yourself and others)?
"What's in it for me"?
Practically speaking, engaging in this course will enable you to
- no longer fear statistics, but instead appreciate and enjoy the beauty and craft of rigorous scientific research ;-)
- design, conduct, analyze, write up, present, and discuss your own quantitative (or mixed-methods) research projects
- tackle your own thesis research projects successfully, by having the most powerful scientific research toolbox at your fingertips
- have enough skills to continue learning and applying scientific/quantitative research methods properly (the goal of the course is to give you a solid basis in the basic research methods and the skills to keep learning and successsfully applying more advanced ones)
Contact Information
- Instructor: Bernhard Riecke: ber1[at]sfu.dot.ca, Web: iSpaceLab.com/Riecke or www.siat.sfu.ca/faculty/Bernhard-Riecke/
- TA: Liaqat Ali: liaqata [at] sfu.ca
- Office hours: by appointment; talking to me after lecture/workshops works best typically
Time & Location
Thursdays, 11:30AM - 2:20PM, in SUR 3260
- First day of class: 5. September
- Last day of class: 28. November
Drop-in office hours & stats/software help/feedback: TBD, maybe directly after class
Course Management System: Canvas
login, then go to "iat 802 Fall 2013".
Course Textbooks
Required
- Field, A., & Hole, G. J. (2003). How to Design and Report Experiments. Sage Publications. ISBN: 0761973834 [get your own copy before the first class - we will go through the whole book]
- Lehman, A., O’Rourke, N., Hatcher, L., & Stepanski, E. J. (2013). JMP for Basic Univariate and Multivariate Statistics: Methods for Researchers and Social Scientists (2nd ed.). SAS Institute. ISBN 1612906036 (the older version which is fine for the course is also available online through SFU lib)
- TBD: Open Learning Initiative Statistics (online learning modules, probably with a $25.00 fee. Registration infos will be provided in class / by email) might also be: Statistical Reasoning by CMU OLI (no-login link & outline)
Other Recommended Resources (most on reserve):
- Evans, A. N., & Rooney, B. J. (2010). Methods in Psychological Research. SAGE. ISBN: 1412977886
- Field, A., Miles, J., & Field, Z. (2012). Discovering Statistics Using R. Sage Publications Ltd. ISBN: 1446200469
- Field, A. (2009). Discovering Statistics Using SPSS (Third ed. or later). Sage Publications Ltd. ISBN: 1847879071
- Cunningham, D., & Wallraven, C. (2011). Experimental Design: From User Studies to Psychophysics (1st ed.). A K Peters/CRC Press. ISBN: 9781568814681
- Oehlert, G. W. (2000).A First Course in Design and Analysis of Experiments. W. H. Freeman. (.pdf of book and data sets available online)
- Vogt, W. P. (2006). Quantitative Research Methods for Professionals (1st ed.). Allyn & Bacon .[excellent non-mathematical overview of different techniques incl. complex ones]
Reference Readings:
Statistics explained in simple terms
- Vickers, A. J. (2009). What is a p-value anyway? 34 Stories to Help You Actually Understand Statistics. Addison Wesley.
- Motulsky, H. (2010). Intuitive Biostatistics: A Nonmathematical Guide to Statistical Thinking. Oxford University Press, USA.
- Urdan, T. C. (2010). Statistics in Plain English, Routledge Academic.
- excellent free online interactive statistics & probability course from udacity by Sebastian Thrun (allthough rather basic)
- StatisticsHell: Excellent & humorous statistics resources & online lecture videos by Andy Field
Reference Readings: Advanced & Modern Statistics Methods
- Wilcox, R. (2011). Modern Statistics for the Social and Behavioral Sciences: A Practical Introduction (1st ed.). CRC Press. ISBN: 1439834563
- Wilcox, R. R. (2010). Fundamentals of Modern Statistical Methods: Substantially Improving Power and Accuracy (2nd ed.). Springer. ISBN: 1441955240
Scholarly writing
- Sternberg, R. J., & Sternberg, K. (2010). The Psychologist’s Companion: A Guide to Writing Scientific Papers for Students and Researchers (5th ed.). Cambridge University Press.
- Field, A., & Hole, G. J. (2003). How to Design and Report Experiments. Sage Publications.
- Williams, J. M., & Colomb, G. G. (2010). Style: Lessons in Clarity and Grace (10th ed.). Longman.
- Booth, W. C., Colomb, G. G., & Williams, J. M. (2008). The Craft of Research, Third Edition (3rd ed.). University Of Chicago Press.
- Boice, R. (1990). Professors as Writers: A Self-Help Guide to Productive Writing. New Forums Press.
- Stevenson, S., & Whitmore, S. (2001). Strategies for Engineering Communication (International student ed.). Wiley.
Further Reference Readings:
- Weinberg, G. M. (2001). An Introduction to General Systems Thinking (25 Anv.). Dorset House. ISBN 0932633498
- “The earth is spherical (p < .05): Alternative methods of statistical inference” by K. J. Vicente & G. L. Torenvliet “Theoretical Issues in Ergonomics Science” (2001); v. 1; pages 248 – 271
- “You can't play 20 questions with nature and win: Projective comments on the papers of this symposium” (1973) by A. Newell; in W. G. Chase (Ed.) Visual Information Processing; New York: Academic Press; pages 283 - 308
Supplementary readings will be announced as needed
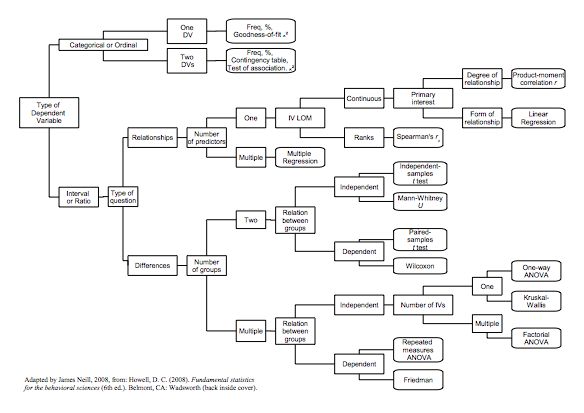
When to use what statistical test?
from UCLS, incl. SAS, Stata, and SPSS examples
from Univ. of Delaware
decision tree by Corston & Colman, 2000
decision tree by Neill, 2008, based on Howell, 2008
Statistics Glossary and Terminology
from Glossary of Statistical Terms (U Berkeley)
JMP Resources
Installation instructions: http://www.sfu.ca/itservices/technical/software.html
Online Tutorials to get you started
- JMP for students basics webcast (recommended starting point if you have little/no experience with JMP)
- Tutorials
- Learning Library
- interactive Concept Discovery Modules
- JMP webcasts
- more JMP infos for students
- JMP Tutorials (text + video) from Florida State Univ.
- JMP Tutorials (text + video) from Winona State Univ.
- JMP Tutorials from Univ. of Tennessee
- YouTube Tutorials for using JMP for statistical analysis( more YouTube statistics tutorials)
- YouTube Channel for stats in JMP (Prof. Parris)
- of just google it... and send me links to useful material you find
Statistics Applets & Tutorials Collections
collection of statistics applets
from hope college
Virtual Laboratories in Probability and Statistics
WISE statistics applets & tutorials
StatPrimer from San Jose State Univ.
Power and Effect Size Calculators
Power and sample size calculator; see also here
Effect size calculator links
Research randomizer: generate random numbers for assigning participants to conditions
[disclaimer: I did not check the correctness of all linked resources]
Writing Resources
Literature Search Engines
- Google Scholar - general
- SFU Library Search or directly here includes access to many databases such as PsychInfo
- ISI Web of Knowledge
- scirus - sciency general lit search engine
- PubMed - specialized
Reference Managers
- Zotero open source reference manager (see tutorial videos on youTube)
- Mendeley free (but not open source) reference manager
- Comparison of reference management software
Reporting Statistics in APA style
- google it...
- blog which addresses common and obscure APA style issues
Introduction & Big Picture
Learning Goals
What, why, so what? Understand course procedures and "big picture"
- Understand course structure and teaching/learning activities and find your way through the course
- Understand Team-Based Learning (TBL), Readiness Assurance Tests (RAT). and JiTT/Warmup exercises: Why do they support effective learning? What's required?
- Get to know & introduce each other
- Start thinking about statistics, quant. Research methods, and potential projects
- Hopefully start getting even more excited about research!
- Explain relevance of rigorous scientific and quantitative research
In-class Activities: Week 1
Introductions
Pre-questionnaire & student expectations survey
Overview of class structure and teaching/learning activities
demo in-class experiment
Sketching research questions & data plots
Intro to Statistical Packages like JMP using data we collected in-class
Q&A
Preview of what's next
Readings for this week (due before lecture)
- I expect all to have read & understood the IAT 802 Course Syllabus and acquired the main (Field & Hole) textbook.
Due This Week
Week 1 preparations:
- Familiarize yourself with the course management system Canvas: login and find the IAT802 tab
- I expect all to have read & understood the IAT 802 Course Syllabus
- Acquire required textbook: Field, A., & Hole, G. J. (2003). How to Design and Report Experiments
- Install JMP on your computer (if you have a laptop, install it there and always bring it to class)
Week 1 follow-up activity
- Start thinking about project ideas, consult your supervisor and/or me if you like
- Start thinking about teams (ideally 2 people each)
Preparation for Next Week
Intro to scientific Research Methods; Quant vs. qual
Learning Goals
aka: After completing this section, you should be able to do the following:
appreciation of qualitative and quantitative rsearch tools as different, yet equally valid toosl, just for a different purpose and aim.
Compare and contrast quantitative vs. qualitative research methods and their respective strengths and purposes, and have a better idea of which approach is most suitable for what kind of goals and circumstances
Related to Field & Hole: Before You Begin (Ch. 1)
- Describe the two fundamental approaches to answer a research question
- Describe similarities and difference between the two approaches
- Describe variables and the ways variables can be measured
- Describe and differentiate between the validity and reliability concepts
- Show an understanding of evolution of theories
- Distinguish between scientific and non-scientific statements
- Show an understanding of nature of scientific method and paradigms in science
- Generate a research topic from available sources
Related to Field & Hole: Planning an Experiment (Ch. 2)
- Describe a process of discovering a research question
- Describe and identify dependent and independent variables for a given research question
- Describe considerations for measuring a dependent variable
- Describe study material and different measurement scales
- Describe different types of validity and reliability considerations
Related to Evans & Rooney: Understanding the Research Literature (Ch. 2)
- Search the literature using common online databases (e.g., scholar.google.com, SFU library links)
- Describe what is meant by the term "peer reviewed" and why this matters
- Describe main sections of a typical research article and what their purpose is
- Define independent, dependent, participant, mediating, and moderating variables
- Identify important variables in a research article
- Explain & evaluate internal vs. external validity
- Describe the typical descriptive statistics found in research articles
- Understand at a conceptual level common parametric tests of significance used in
- List common nonparametric alternatives to parametric tests of significance
- Understand how confidence intervals are used in estimating parameters
Related to JMP book: Basic Concepts in Research and Data Analysis (Ch. 1)
- Describe steps to follow when conducting research
- Describes the concepts of variables, values, and observations
- Describe the scales of measurement and JMP modeling types
- Describe basic approaches to research
- Descriptive versus Inferential Statistical Analysis
- Hypothesis Testing
Related to JMP book: Assessing Scale Reliability and Coefficient Alpha (Ch. 6)
- Describe the basics of scale reliability
- Describe Cronbach’s coefficient Alpha
- Show an understanding of Cronbach Alpha’s computation
Related to Stats Tutorials
- Understand the importance of complex, messy, real data
- Understand how we can use graphics to explore and understand data
- Gain familiarity with basic data collection, storage and manipulation tools
- Understand the programs and tools which will enable us to be successful
- Understand some basic concepts of research and its methodologies
- Distinguish between a population and a sample
- Understand why it is important to choose a probability sample
- Distinguish between an ‘estimate’ or a ‘statistic’ and the ‘parameter’ of interest
Key Concepts
- Variables: Independent (predictor) variables vs. dependent (outcome) variables
- Variable measurements: Nominal, Ordinal, Interval, and Ratio
- Correlational (observational) research vs. Experimental research
- Scales: Self-report measure, Likert scale, VAS scale
- Scale reliability
- Coefficient alpha
- Validity: Content validity, Criterion validity, Factorial validity
- Reliability
- Measurement error
- descriptive statistics
- Central tendencies: mean, median, mode
- Variability
- Strength of relationships
- Iinferential statistics
- Hypothesis testing
- Levels of measurement
- Categorical: Binary (2 categories); nominal (>2 categories)
- Ordinal (logically ordered)
- Continuous: interval (i.e., intervals make sense) ; ratio (ratios make sense)
- Confounding/extraneous variables
In-class Activities: Week 2
TBL activities
- iRAT (individual Readiness Assurance Test, a Team-Based Learning approach, see teambasedlearning.org for details)
- tRAT (team-based Readiness Assurance Test)
- Peer-review & Discussion
- Working with project ideas: partner research idea pitch activity
- [Survey feedback & Q&A if sufficient responses are ]
- [Working with JMP interface: postponed until next week, when there's more time & Liaqat is back]
Second half of session is jointly with IAT 801: “Quantitative research methods and design” by Thecla Schiphorst: be prepared to ask questions about and discuss different research approaches
Readings for this week
See "to-do's for week 2" in Canvas
Due This Week
Do readings & see "to-do's for week 2" below
Preparation for Next Week
Exp. design, Descriptive Stats, Research Ethics
Learning Goals
Related to Field & Hole: Experimental Designs (Ch. 3)
- Describe the aims of Research: Reliability, Validity, and Importance
- Describe the factors that make a study design good
- Describe the factors that make a study design bad
- Show an understanding of how reliability can be maximized
- Describe threats to internal validity
- Describe threats to external validity
- List the various ways researchers use to measure observable behavior
- Describe how precision of measurement affects statistical power
- Define reliability and describe ways of assessing reliability
- Describe the various types of validity and how they are assessed
- Describe different methods of doing research
- Describe types of Quasi-experimental designs
- Describe between-group (independent measure) and within-group (repeated measure) designs
- Describe importance of randomization in experimental research designs
- Describe advantages and disadvantages of repeated measure designs
- Describe advantages and disadvantages of independent measure designs
- Describe single-subject experimental designs
- Show an understanding of the logical basis of the experimental design
- Show an understanding of the ethical considerations in running a study
- Describe the advantages and disadvantages of controlled experiments and field experiments
- Describe the nature of an independent groups design
- Describe the difference between a completely randomized groups and a randomized factorial designs
- Interpret the statistical outcome of each design, including main effects and interactions
- Design an experiment to assess a given hypothesis
Related to Evans & Rooney: Research in psychology: An ethical enterprise (Ch. 3)
- Describe the five general principles that guide psychologists
- Describe the ethical standards of the APA, particularly as they apply to researchers, including confidentiality, informed consent, reduction of harm, privacy, deception, and debriefing
- [Describe the standards regarding the use of animals in research]
- Define and identify examples of plagiarism
- Identify ethical problems in a research study.
Related to Field & Hole: A Quick Guide to Writing a Psychology Lab-Report (Ch. 9)
- Describe various sections of a report
- Describe the types of questions answered in the Introduction section of a report
- Describe the types of questions answered in the Method section of a report
- Describe design
- Describe participants
- Design apparatus
- Describe the types of questions answered in the Result section of a report
- Describe the types of questions answered in the Discussion section of a report
Related to the JMP book:Getting Started with JMP (Ch. 2)
- Demonstrate installation of JMP
- Demonstrate launching of the JMP application
- Show an understanding of the JMP approach to Statistics
Related to the JMP book:Working with JMP Data (Ch. 3)
- Demonstrate opening a data table
- Demonstrate interaction with the JMP platform
- Interact with JMP Help
- Demonstrate an understanding of JMP tables, rows, and columns
- Demonstrate entry of data into JMP tables
- Show an understanding table data management in JMP
Related to tutorials
- Understand the general logic of why a confidence interval works.
- How to graph a confidence interval for a single parameter.
- How to interpret graphs of several confidence intervals.
- Effect of sample size upon the size of a confidence interval.
- Effect of variability upon the size of a confidence interval.
- Effect of confidence level upon the size of a confidence interval.
Key Concepts
aka: you should be able to discuss / explain those terms, and apply them in your own reasearch project
Ch. 2: Experimental Designs
- Internal Validity Threats: Group threats, Regression to Mean, Time Threats, History, Maturation, Instrument Change, Differential Mortality, Reactivity and Experimental Effects
- External Validity Threats: Over-use of special participation groups, restricted number of participants
- Observational vs. Quasi-experimental vs. Experimental designs
- Experimental designs: Between-group vs. Within-group
Ch. 2-3: Getting Started with JMP & Working with JMP Data
- JMP - a statistical analysis software
- JMP data Table, Row, and Column
Ch3: Research Ethics
- Informed consent
- Confidentiality
- Bias
- Plagiarism
In-class Activities: Week 3 (DRAFT)
- JiTT / questionnaire feedback
- Discussion on project proposals
- Research ethics: Presentation & discussion of Zimbardo's Stanford Prison Experiment
& his TED talk on the Psychology of Evil; here's a shorter version
- > brainstorm potential ethical issue in your own research
- [time permitting:] Discussion on research ethics, biases etc. using examples:
- if Prof/TA asks students in course to participate in their exp.
- using your own family/friends (e.g., advertizing on facebook) for your research
- in general: why care about research ethics?
- Discussion of plagiarism (examples: PhD theses)
- Plagiarism is often a concern for both students and instructors. Read SFU's policy on plagiarism and, in groups of three, discuss whether you think the policy is reasonable and if not, how you would change the policy.
-
[time permitting:] discussion of reading material & reflections
- example: what's a scientific hypothesis vs. theory? And what's wrong about this explanation
TBL activities
- iRAT, tRAT, discussion
- Demo of how to work with JMP on a given data set, in preparation for:
- individual / paired iron statistician practice session
Readings for this week
see "to-do's for week 3" below
Due This Week
Do readings & see "to-do's for week 3" below
Preparation for Next Week
What to Measure? How? With Whom?
Learning Goals
- Overall: be able to design, conduct, and analyze a simple survey
- describe and discuss possible issues and limitations of different survey questions / kinds and sampling methods used
Research Proposals
How to come up with a clear & concise idea for research proposal?
how to ensure it's interesting, relevant, doable, and publishable?
Related to Field & Hole: Descriptive Statistics (Ch. 4)
- Define the terms sample vs. population
- Describe data summarization methods
- Describe frequency distribution and various types of distributions
- Describe measures of central tendency
- Describe the difference between various sampling types i.e. random, systematic, stratified etc.
- Determine the best sampling method for a given research problem
- Describe the relationship between sample size and effect size
- Describe the relationship between statistical power and sample size.
- Show an understanding of effects of outliers
- Discuss power and consider ways of increasing the power of their test of the null
- Discuss the importance of effect size and estimate effect size for a given test of the null
- Describe standard deviation and shape of the distribution
- Show an understanding of confidence interval
- Show an understanding of how to interpret graphs of several confidence intervals
- Show an understanding of descriptive statistics
- central tendencies: mean, median, mode
- variability
- strength of relationships
- Describe the typical descriptive statistics found in research articles
Related to the JMP book:Distribution Platform and Data Plotting (Ch. 4)
- Describe the importance of descriptive analysis
- Describe various types of summary statistics and their pros and cons
- Demonstrate an understanding of performing a descriptive analysis
Related to the JMP book: Measures of Bivariate Association (Ch. 5)
- Show an understanding of choosing a correct statistic
- Describe Pearson Correlations
- Consider the implications of inferential error and statistical significance
Related to tutorials
- Understand the general logic of why a confidence interval works.
- How to graph a confidence interval for a single parameter.
- How to interpret graphs of several confidence intervals.
- Effect of sample size upon the size of a confidence interval.
- Effect of variability upon the size of a confidence interval.
- Effect of confidence level upon the size of a confidence interval
- Understand why we experiment?
- Distinguish among the roles of randomization, replication, and blocking
- Understand the key components of an experiment
- Understand important terms & concepts related to an experiment & illustrate those
Key Concepts
- Sample vs. Population
- Measures of central tendency: Mean vs. Median vs. Mode
- Frequency distributions
- Standard deviation
- Normal curve
- Report Design: Introduction vs. Method vs. Results vs. Discussion
- Pearson Correlations
- Report sections: Abstract, Introduction, Study, Results, Discussion, Conclusion, References
In-class Activities: Week 4
- various organisationsal things
- Project proposal discussion & peer-feedback activity
- Iron Statistican Practice session on Descriptive Statistics.
Readings for this week
see "to-do's for week 4" below
Due This Week
Do readings & see "to-do's for week 4" below
Preparation for Next Week
Inferential Statistics
Learning Goals
Related to Field & Hole: Inferential Statistics (Ch. 5)
- Generate conceptual understanding of statistical or experimental hypotheses
- Describe Fisher’s confidence criterion
- Show an understanding of how to gain confidence about experimental results
- Describe with examples a control group and an experimental group
- Show an understanding of sample probabilities
- Differentiate between systematic variation and unsystematic variation
- Show an understanding of a test statistic.
- Describe the coefficient of determination
- Show understanding of total variance, model variance, residual variance
- Describe correlation & association
- Consider the implications of inferential error and statistical significance
- Describe the outcomes of an inferential decision and provide the probability
- Describe the Type I, Type II errors,
- Discuss power and consider ways of increasing the power of their test of the null
- Discuss the importance of effect size and estimate effect size for a given test of the null
- Describe one-tail and two-tail tests
Related to Field & Hole: Parametric Statistics (Ch. 6)
- Describe most common types of inferential statistics
- Describe parametric and nonparametric tests
- Describe homogeneity of variance and the concept of sphericity
- Describe t-test test, independent t-test, and dependent t-test
- Show an understanding of effect size calculation for t-tests
- Interpret and write the results of the independent t-test
Related to JMP book: t-Tests: Independent Samples and Paired Sample (Ch. 7)
- Describe two types of t-Tests
- Show an understanding of the Independent-Samples t-Test
- Describe the paired-samples t-Test
related to tutorials
TBD
Key Concepts
-
Ch. 5: Inferential Statistics
- Inferential statistics
- Confidence criterion
- Sample probabilities: Systematic variation vs. Unsystematic variation
- Test statistic
- Statistical significance & inference
- Type I vs. Type II errors
- Power (and power analysis)
- Effect size: e.g.
- Cohen’s d (t-tests...)
- r & r^2
- eta^2 (ANOVA...)
- Correlation & association
- One-tail vs. two-tail tests
Ch. 6: Parametric Statistics
- Parametric vs. nonparametric tests
- Homogeneity of variance vs. sphericity
- t-test test vs. independent t-test vs. dependent t-test
- ANOVA: one-way vs. two-way
In-class Activities: Week 5
short iRAT/tRAT quiz
activity on 2 versions for research proposals
Feedback on previous iron Stats test
show examples & discuss
irons stats test (paired, ungraded)
simple data plotting & t-test/1-way ANOVA; keep it short to allow for more discussion
time permitting: iron stats peer-evaluation
if there's time left: overview on how to plot/present data
Readings for this week (and the JiTT assignment)
- Field & Hole: Inferential Statistics (Ch. 5)
-
Field & Hole: Parametric Statistics (Ch. 6) 6.1 - 6.7; later subsections in next week
Video Tutorial: JMP for Students 2: Basic Statistics: watch the whole video
-
JMP book: t-Tests: Independent Samples and Paired Sample (Ch. 7)
- Task: design simple independent groups experiment that could be conducted as part of this course
- suggested complementary reading: from OLI Statistical Resoning course, UNIT 4: Inference, Modul 8 & 9, (cf. TOC)
Continue brainstorming ideas for your own research project
Schedule meeting w/ Bernhard to discuss your research project.
Brainstorm ideas for a small doable experimental research project that you might be able to conduct as part of this course (this can be changed / refined later). Check with your supervisor(s), with us, or anybody else that can guide you. Once you have a first idea of what to do, describe how you would operationalize the variables. Provide a first draft of your
- Research question(s) and hypotheses
- Motivation ("why" and "so what")
- IV (aka predictor variables)
- DV (aka outcome variables)
- any control procedures you would need to use
[see JiTT for details]
Due This Week
Do readings & see "to-do's for week 5" below
Preparation for Next Week
Exp. Design: Dependent & Mixed groups;
Learning Goals
Related to Field & Hole: Parametric Statistics (Ch. 6)
- Describe the analysis of variance (ANOVA) test
- Describe one-way independent ANOVA
- Show an understanding of effect size calculation for one-way ANOVA
- Interpret and write the results of the one-way independent ANOVA
- Describe one-way repeated-measures ANOVA
- Show an understanding of effect size calculation for one-way repeated-measures ANOVA
- Interpret and write the results of the one-way repeated measures ANOVA
- Describe two-way independent ANOVA
- Show an understanding of effect size calculation for two-way independent ANOVA
- Interpret and write the results of the two-way independent ANOVA
- Interpret interaction graphs
- Describe two-way mixed ANOVA
- Show an understanding of effect size calculation for two-way mixed ANOVA
- Interpret and write the results of the two-way mixed ANOVA
- Describe two-way repeated-measures ANOVA
- Show an understanding of effect size calculation for two-way repeated-measures ANOVA
- Interpret and write the results of the two-way repeated measures ANOVA
- Describe analysis of covariance (ANCOVA)
Related to JMP book: t-Tests: One-Way ANOVA Between-Subjects Factor (Ch. 8)
- Describe the basics of One-Way ANOVA Between-Subjects Design
- Describe significant differences between experimental conditions
- Describe nonsignificant differences between experimental conditions
- Show an understanding of the meaning of the F Statistic
- Describe the assumptions underlying One-Way ANOVA with one between-subjects factor
Related to JMP book: Factorial ANOVA with Two Between-Subjects Factors (Ch. 9)
- Describe the basics of Factorial Designs
- Describe some possible results from a Factorial ANOVA
- Show an understanding of nonsignificant interaction
- Show an understanding of significant interaction
- Describe the assumptions for Factorial ANOVA with two between-subjects factors
Related to JMP book: Multivariate Analysis of Variance (MANOVA) with One Between-Subjects Factor (Ch. 10)
- Describe the the basics of Multivariate Analysis of Variance (MANOVA)
- Show an understanding of multivariate measure of Association
- Demonstrate an understanding of performing a MANOVA with the Fit Model Platform
- Describe significant differences between experimental Conditions
- Describe nonsignificant Differences between Experimental Conditions
- Describe assumptions underlying MANOVA with one between-subjects factor
Related to JMP book: One-Way ANOVA with One Repeated-Measures Factor (Ch. 11)
- Describe the the basics of repeated-measures design
- Differentiate between the repeated-measures design and the between-subjects Design
- Choose between univariate or multivariate ANOVA for Repeated-Measures Analysis
- Describe assumptions of the multivariate analysis of design with one repeated-measures factor
Related to JMP book: Factorial ANOVA with Repeated-Measures Factors and Between-Subjects Factors (Ch. 12)
- Describe the the basics of mixed-design ANOVA
- Show an understanding of possible results from a two-way mixed-design ANOVA
- Describe problems with the mixed-design ANOVA
- Show an understanding of nonsignificant interaction in mixed-design ANOVA
- Show an understanding of significant interaction in mixed-design ANOVA
- Describe an alternative approach to a univariate repeated-measures Analysis
Key Concepts
-
Ch. 6: Parametric Statistics
- ANOVA: Analysis of variance
- One-Way Independent ANOVA vs. One-Way Repeated-Measures ANOVA
- Effect size One-Way ANOVA vs. One-Way Repeated-Measures ANOVA
- Two-Way Independent ANOVA vs. Two-Way Repeated-Measures ANOVA
- Effect size Two-Way ANOVA vs. Two-Way Repeated-Measures ANOVA
- Mixed Anova
- ANCOVA: analysis of covariance
JMP book Ch. 8-12:
- Factorial Designs: Factorial ANOVA vs. MANOVA
- Nonsignificant interaction vs. significant interaction
- Assumptions: Between-Subjects Factors vs. MANOVA
- Univariate vs. Multivariate ANOVA for Repeated-Measures
In-class Activities: Week 6
- Planning of your presentations for IAT801
- How to quickly skim papers? (think-pair-discuss)
- Elevator pitch project presentations (at least for those who's project ideas is well enough developped)
- in pairs, then a few in front of class (time permitting)
- Iron statistician activity
- Plot (descriptive stats)
- Analyze (inferential stats)
- Write up (scholarly)
-
TBL activities
- iRAT / tRAT (TBD)
- Perform IronStattest on ANOVA. Download the file “Iat802_ironStatsWeek6_YourfirstnameYourlastname”
note: Bernhard out of town this week (conference in Japan)
Readings for this week (and the JiTT assignment)
-
Field & Hole: Parametric Statistics (Ch. 6)
-
JMP book: t-Tests: One-Way ANOVA Between-Subjects Factor (Ch. 8)
-
JMP book: Factorial ANOVA with Two Between-Subjects Factors (Ch. 9)
-
JMP book: Multivariate Analysis of Variance (MANOVA) with One Between-Subjects Factor (Ch. 10)
-
JMP book: One-Way ANOVA with One Repeated-Measures Factor (Ch. 11)
-
JMP book: Factorial ANOVA with Repeated-Measures Factors and Between-Subjects Factors (Ch. 12)
- suggested complementary reading: from OLI Statistical Resoning course, UNIT 4: Inference, Module 10-12, (cf. TOC)
Due This Week
Do readings & see "to-do's for week 6" below
Preparation for Next Week
Elevator pitch; 801/802 presentations
Learning Goals
Related to Field & Hole: Non-parametric Statistics (Ch. 7)
- Describe the the rationale of Non-parametric tests and name four common tests
- Describe the Mann-Whitney test
- Describe the Wilcoxon Signed-Rank test
- Describe the Kruskal-Wallis test
- Describe the Friedman's ANOVA
Related to Field & Hole: Choosing Statistical Tests (Ch. 8)
- Describe the need to think about statistics at the outset of designing a Study
- List and answer the five questions regarding selection of a statistical test
- Identify sources of confusion in deciding which test to use
- Demonstrate application of five questions to choose a correct test
Related to the JMP book: Measures of Bivariate Association (Ch. 5) - Repeated
- Show an understanding of choosing a correct statistic
- Describe Pearson Correlations
- Consider the implications of inferential error and statistical significance
Key Concepts
-
Ch. 7-8: Non-parametric Statistics & Choosing Statistical Tests
- Non-parametric test
- Mann-Whitney test vs. Wilcoxon Signed-Rank test vs. Kruskal-Wallis test
- Friedman's ANOVA
- Five Questions to choose a correct test
In-class Activities: Week 7
- Iron Stats feedback from last week
- elevator pitch of your research projects: Activity & feedback; be prepared to present (90sec)
- research proposal activity: probably preparation and discussion of peer-reviewing
- final discussion of research proposals
- before submitting for peer review on Sunday night
- organize peer-review; teams of 3 or 4
- each person reviews 2 team members
- [if time left] Iron statistician activity
- Plot (descriptive stats)
- Analyze (inferential stats)
- Write up (scholarly)
- [if time left] TBL activities
- iRAT peer review
- Perform IronStattest on non-parametric. Download the file “Iat802_ironStatsWeek7_YourfirstnameYourlastname”
first joint presentation & discussion session with IAT801 (Qualitative research methods & design) in room 3010
2 presentations from our course in teams of 2-3
- instructions:Canvas > files > assignments > iat802_ResearchMethodsPresentation.docx
schedule for Thursday Oct 17th, staring at 1pm
1:00 pm to Organize and Review presentation processGroup 1 IAT 801 1:10
Group 2 IAT 802 1:15: Power Analysis | Carolyn Pang, Sujoy Hajra, Emily Cramer
Group 3 IAT 801 1:30
Group 4 IAT 802 1:45: Data Distributions | Drawing Data | Sohail Md, Ethan Soutar-Rau
Group 5 IAT 801 2:00
Readings for this week (and the JiTT assignment)
-
Field & Hole: Non-parametric Statistics (Ch. 7)
-
Field & Hole: Choosing Statistical Tests (Ch. 8)
-
JMP book: Measures of Bivariate Association (Ch. 5) - Repeated
- Review previous reading as needed (especially if the self-test revealed open questions). Most Essential: chapters 4-8, 11, and 13-14 (upcoming); you should really know these things and be ably to apply them
Due This Week
Do readings & see "to-do's for week 7" below
Preparation for Next Week
801/802 presentations
Learning Goals
Related to Field & Hole: General Points While Writing a Report (Ch. 10)
- Describe the standardized format of a Report
- Describe some important report writing considerations
- Show an understanding of different report writing styles
- Recognize importance of giving yourself enough time for writing a report
Related to Field & Hole: Answering the Question 'Why?' The Introduction Section(Ch. 11)
- Show an understanding of how to provide a rationale
- Know how to describe previous research and its findings
- Demonstrate outlining of your own experiment
- Know how to provide predictions about the experiment's outcome
Related to Field & Hole: Answering the Question 'How?' The Method Section (Ch. 12)
- Show an understanding of research design
- Describe the consideration for selecting study participants
- Describe the consideration for selecting study apparatus
- Describe the consideration for outlining a study procedures
Learning goals for presentations
- What is science, the “scientific method” and quantitative research? How do you think and argue like a good scientist?
- Why do science? What is scientific & quantitative research useful for?
- Why could you be excited about science? What drives and excites a researcher?
- What are advantages and disadvantages of quantitative & scientific research methods (as compared to other methods)? That is, what are they appropriate and useful for?
- What to research? Why research something?
- How to devise effective research questions and hypotheses?
- How to effectively motivate research questions?
Key Concepts
- see above
In-class Activities: Week 8
- TBD:
- Organizational things…
- Some stats mnemonics
- Research Proposal Q&A
- JMP interactive demo & Q&A session
- ANOVA flavours, postHoc tests
- 1pm: Joint research methods presentations w/ IAT801
second joint presentation & discussion session with IAT801 (Qualitative research methods & design) in room 3010
3 presentations from our course in teams of 2-3
- instructions:Canvas > files > assignments > iat802_ResearchMethodsPresentation.docx
schedule for Thursday Oct 24th, staring at 1pm
1:00 pm to Organize and Review presentation processGroup 1 1:10: Correlational Research & Quantitative Survey | Reese Muntean, Xiao Zhang, Xiaolan Wang
Group 2 1:15
Group 3 1:30: t-Test | Srecko Joksimovic, Sanam Shirazi, Xin Tong
Group 4 1:45
Group 5 2:00: Confounds | Mirjana Prpa, Jacqueline Jordan, Ankit Gubta
Readings for this week (and the JiTT assignment)
- Field & Hole: Example of Experimental Write-Up (Ch. 16)
- Field & Hole: General Points While Writing a Report (Ch. 10)
- Field & Hole: Answering the Question 'Why?' The Introduction Section(Ch. 11)
- Field & Hole: Answering the Question 'How?' The Method Section (Ch. 12)
Due This Week
Do readings & see "to-do's for week 8" below
Preparation for Next Week
Doing your own research
Learning Goals
-
Related to Field & Hole: Answering the Question 'What Did I Find?' The Results Section (Ch. 13)
- Show an understanding of how to provide a rationale
- Know how to describe previous research and its findings
- Demonstrate outlining of your own experiment
- Know how to provide predictions about the experiment's outcome
Related to Field & Hole: Answering the Question 'Why?' The Introduction Section(Ch. 14)
- Show an understanding of how to provide a rationale
- Know how to describe previous research and its findings
- Demonstrate outlining of your own experiment
- Know how to provide predictions about the experiment's outcome
Related to Field & Hole: Answering the Question 'Why?' The Introduction Section(Ch. 15)
- Show an understanding of how to provide a rationale
- Know how to describe previous research and its findings
- Demonstrate outlining of your own experiment
- Know how to provide predictions about the experiment's outcome
Related to Field & Hole: Answering the Question 'Why?' The Introduction Section(Ch. 16)
- Show an understanding of how to provide a rationale
- Know how to describe previous research and its findings
- Demonstrate outlining of your own experiment
- Know how to provide predictions about the experiment's outcome
In-class Activities: TBD
Proposal feedback
Brief iRAT/tRAT quiz
maybe: speed writing & data plotting intro
Interactive demo: non-parametric tests in JMP
TBL activities
- iRAT & tRAT peer review
- Perform IronStattest on ANOVA and non-parametric test
Readings for this week (and the JiTT assignment)
- Field & Hole: Answering the Question 'What Did I Find?' The Results Section (Ch. 13)
- Field & Hole: Answering the Question 'So What?' The Discussion Section(Ch. 14)
- Field & Hole: Title, Abstract, References and Formatting (Ch. 15)
Due This Week
Do readings & see "to-do's for week 9" below
Preparation for Next Week
Getting ready for Running your own Stats
Learning Goals
.
Key Concepts
- .
In-class Activities
- JMP: demo of assumption testing for different tests
- using data visualization/sketching as part of the research process
- Iron Researcher test on ANOVAs (paired)
- TBD
open lab: optional JMP tutorial session: Wed 1-2pm, in room SRY 3066
Readings for this week (and the JiTT assignment)
- see weekly todo list
Due This Week
Do readings & see "to-do's for week 10" below
Preparation for Next Week
What does your data tell you?
Learning Goals
- being able finish desinging your experiment, and run in properly following ethics standards
- visualize your data in suitable and effective data plots
- pick the right statistical analysis tools, perform statistical analysis, and report results in scholarly manner (using APA style for inferential statistics).
- How to use quantitative & scientific methods properly, carefully & effectively?
- Experimental design: How to design an effective experiment? What does effective mean?
- Descriptive statistics: How to present data effectively? What does effective mean?
- Inferential statistics: What can you conclude from quantitative data? Why? What are your chances of being wrong? How do you decide which statistical methods to use? How to apply them properly? How to do this in a given statistical analysis software?
- How to communicate scientific research effectively and scholarly?
- How to critically evaluate and discuss the quality of quantitative / scientific research (of yourself and others)?
In-class Activities: TBD
- discuss the peer-reviewing system & authorship rules
- Colloquium presentation: what to focus on; Q&A
- discussion of final paper expectation and grading rubric: make sure to carefully read iat802_ResearchPaperTemplate_guidelinesAndChecklists.pdf on sakai/resources/assignments/
- continue the sektch-your-data activity from last week (so please bring any sketches you might already have or did during the last session so you can continue from there)
- Data analysis Q&A;
- iron stats Q&A before practice session
- iron stats practice session (simulation of actual test, ungraded);
Readings for this week (and the JiTT assignment)
- no dedicated readings to give you more time for your projects. Although reviewing earlier readings and updating notes is always useful ;-)
Due This Week
Do readings & see "to-do's for week 11" below
Preparation for Next Week
Iron Stats exam; How to Present Things Scholarly?
Learning Goals
- How to use quantitative & scientific methods properly, carefully & effectively?
- Experimental design: How to design an effective experiment? What does effective mean?
- Descriptive statistics: How to present data effectively? What does effective mean?
- Inferential statistics: What can you conclude from quantitative data? Why? What are your chances of being wrong? How do you decide which statistical methods to use? How to apply them properly? How to do this in a given statistical analysis software?
- How to communicate scientific research effectively and scholarly?
- How to critically evaluate and discuss the quality of quantitative / scientific research (of yourself and others)?
Activities
iron stats graded in-class test
-
this final challenge (aka exam) will be individual, with time limit (probably 60min), and the final results will be a .pdf which is the writeup of the data plotting & analysis + results & discussion section in form of a mini-report; template will be provided
> break <
final project presentation Q&A
summary on using effective illustrations for your paper/presentation
summary on reporting statistics for your paper/presentation
[optional] how to give effective presentations (happy to just send slides…)
Project presentation practice & feedback activity,
Readings
- carefully read iat802_ResearchPaperTemplate_guidelinesAndChecklists.pdf on sakai/resources/assignments/
- Chapter 5 ("Planning and writing the experimental research paper") from Sternberg, R. J., & Sternberg, K. (2010). The Psychologist’s Companion: A Guide to Writing Scientific Papers for Students and Researchers (5th ed.). Cambridge University Press. (see sakai); feel free to skip 5.1.7 - 5.1.13 & 5.3. make sure to read 5.5 thoroughly.
- as mentioned earlier, a great annotated sample paper is provided in chapter 16 of Field, A., & Hole, G. J. (2003). How to Design and Report Experiments. Sage Publications. (see sakai / resources / reading material). Check out the results section before the iron stats test for examples how to phrase results in human-readable form.
- [optional: in case you'd like to read more about scholarly writing and how to improve your writing, I can highly recommend the following books:
- Sternberg, R. J., & Sternberg, K. (2010). The Psychologist’s Companion: A Guide to Writing Scientific Papers for Students and Researchers (5th ed.). Cambridge University Press.
- Field, A., & Hole, G. J. (2003). How to Design and Report Experiments. Sage Publications.
- Williams, J. M., & Colomb, G. G. (2010). Style: Lessons in Clarity and Grace (10th ed.). Longman.
Due This Week
Do readings & see "to-do's for week 12" below
Preparation for Next Week
Communicating your research; Colloq presentations
Learning Goals
- How to use quantitative & scientific methods properly, carefully & effectively?
- Experimental design: How to design an effective experiment? What does effective mean?
- Descriptive statistics: How to present data effectively? What does effective mean?
- Inferential statistics: What can you conclude from quantitative data? Why? What are your chances of being wrong? How do you decide which statistical methods to use? How to apply them properly? How to do this in a given statistical analysis software?
- How to communicate scientific research effectively and scholarly?
- How to critically evaluate and discuss the quality of quantitative / scientific research (of yourself and others)?
Schedule:
Wed 27th November in SIAT research colloquium, SUR5380: short 5
min) Research Project Presentations for all!
Presentation schedule
...
Presentation rules:
- strict time limit: 5min/person (we have 15 presentations to go through!)
- suggestion: 5min presentation + 1 min for questions while the next person is setting things up
- It'll be graded (10%), see course syllabus
- Slides will need to be uploaded and tested on presentation computer well before (!) 2:30, probably around 2:15
- Please add your name & title to sakai wiki / "Colloquium Presentations" to claim your spot and pick the order
- if you really really cannot attend on that date, email me so we can re-schedule your presentation for one of the remaining classes in week 12 or 13 (please suggest a date)
- we'll probably do the course evaluations at the end of this session, so please stay around.
- make sure you uploaded your presentation to dropbox/iat802_finalColloqPresentations and tested on the lectern computer well before the session starts.
What your final presentation will be graded on (roughly)
- Content & Quality (of presentation)
- Why? Motivation
- make sure you attract the audience's interest from the beginning. Keep in mind that it's a mixed audience, and many will not be familiar with your research area.
- What? Problem & your solution; what did you find?
- make sure to include effective data plotsthat highlight your findings and adress your research questions effectively (if you don't have any data yet you might need to be creative...).
- So What? Conclusions & take-home-message
- make sure the audience understands this! What do you want them to remember? You might want to summarize/highlight this on your last slide.
- Why? Motivation
- Form (How it was presented) Form & Clarity: Was the presentation clear, well-structured, and easy to follow and understand?
- Timing: good usage of the allotted time?
- Enthusiasm: Was presenter exited about project & got enthusiasm across?
- Other noteworthy things… Humour, audience interaction, good props/video/pics, was it memorable & effective?...
things to consider:
- what are the most important things you'd like your audience to take away? Does your presentation focus on those?
- What's less important and might be omitted (e.g., methodological details unless important)
- Do you have a clear abd powerful beginning and end (and are they supported well by your slides)?
Presentation samples, mini-paper & discussion
- Inspiration: check on the web, e.g., Rosling or other TED talks; paper preview presentations in, e.g., Siggraph and other conferences.
mini-paper: What would you like to see in 5min presentation of study/data?
Lecture Activities
- revision strategies for your writing (lecture + discussion):
- Peer-reviewing of final papers
joint IAt801/802 celebration in Brew Pub Seating Area with Fireplace, Wednesday Nov 27th from 6:00 - 9:00 pm.
.
Readings
- carefully read iat802_ResearchPaperTemplate_guidelinesAndChecklists.pdf on sakai/resources/assignments/
- Chapter 5 ("Planning and writing the experimental research paper") from Sternberg, R. J., & Sternberg, K. (2010). The Psychologist’s Companion: A Guide to Writing Scientific Papers for Students and Researchers (5th ed.). Cambridge University Press. (see sakai); feel free to skip 5.1.7 - 5.1.13 & 5.3. make sure to read 5.5 thoroughly.
- as mentioned earlier, a great annotated sample paper is provided in chapter 16 of Field, A., & Hole, G. J. (2003). How to Design and Report Experiments. Sage Publications. (see sakai / resources / reading material). Check out the results section before the iron stats test for examples how to phrase results in human-readable form.
- [optional: in case you'd like to read more about scholarly writing and how to improve your writing, I can highly recommend the following books:
- Sternberg, R. J., & Sternberg, K. (2010). The Psychologist’s Companion: A Guide to Writing Scientific Papers for Students and Researchers (5th ed.). Cambridge University Press.
- Field, A., & Hole, G. J. (2003). How to Design and Report Experiments. Sage Publications.
- Williams, J. M., & Colomb, G. G. (2010). Style: Lessons in Clarity and Grace (10th ed.). Longman.
Due This Week
Do readings & see "to-do's for week 13" below
Preparation for Next Week
Aftermath
Learning Goals
.
Activities
.
Due This Week
- Relax & have a wonderful semester break!
- thanks for all the great projects, suggestions, and feedback!
- let me know if you have any plans on submitting your project for publicatioun - I'd be happy to support this & help. In a way, that would be the most impressive course outcome if you get to submit your project.
Preparation for Next Week