STAT 330 Lecture 29
Reading for Today's Lecture: 12.1, 12.2,12.3
Goals of Today's Lecture:
Today's notes
In the model
![]()
if the levels of ![]() are the only levels of interest of
Factor 1 we call Factor 1 (and the
are the only levels of interest of
Factor 1 we call Factor 1 (and the ![]() ) a fixed effect. If on the
other hand they are a sample of size I from a population of possible
levels we refer to Factor 1 as a random effect. Often Randomized
Blocks designs have blocks which are regarded as random. For instance
in an experiment where 5 runs of some production process can be run on
a single day we often treat DAY as a blocking factor and then pretend
the days we tried are a sample of possible days.
) a fixed effect. If on the
other hand they are a sample of size I from a population of possible
levels we refer to Factor 1 as a random effect. Often Randomized
Blocks designs have blocks which are regarded as random. For instance
in an experiment where 5 runs of some production process can be run on
a single day we often treat DAY as a blocking factor and then pretend
the days we tried are a sample of possible days.
We call the Model a Fixed Effects model if both factors are fixed, a Random Effects model if both are random and a Mixed model if we have one fixed and one random factor. For mixed models with replicates we get different F tests for main effects. Moreover, the injunction that we test main effects only when there are no interactions is no longer relevant.
END OF CHAPTER 11
Simple Linear Regression and Correlation
Here are two experimental designs used to investigate the relation between two continuous variables.
1: Controlled Experiment: A variable, X is set at values ![]() and
corresponding values
and
corresponding values ![]() of a response variable are measured.
of a response variable are measured.
Example: Chapter 12, question 9. x is the "Burner area liberation rate" and
Y is the ![]() (nitrous oxides) emission rate.
(nitrous oxides) emission rate.
2: A sample of n pairs: We sample a population of n pairs of numbers and
get ![]() .
.
Example: we sample 1074 families and measure the Father's height (X) and Son's height (Y) for each family.
In this section our goal is to predict Y from the value of X and not the other way around. We do not treat the variables symmetrically.
Regression Models:
We assume for each observation a model equation of the form
![]()
where
Assumptions:
Definition: The regression is called linear if ![]() is a linear function of
is a linear function of
![]() . (This jargon is used also when each of X and
. (This jargon is used also when each of X and ![]() is a vector.)
is a vector.)
Our example is Simple Linear Regression.
![]()
where the ![]() are independent mean 0 homoscedastic errors.
(Notice that the map
are independent mean 0 homoscedastic errors.
(Notice that the map ![]() is a linear function
of
is a linear function
of ![]() . At the same time this model describes a straight line
function of x.
. At the same time this model describes a straight line
function of x.
Estimation
Estimation is based on least squares. We choose ![]() to minimize
to minimize
![]()
To minimize this we take the derivatives ![]() and
and
![]() and set them both equal to 0. We get
and set them both equal to 0. We get
![]()
and
![]()
These two equations are called the normal equations usually written in the form
![]()
and
![]()
The solution is
![]()
and
![]()
There is an ANOVA table for this least squares analysis based on the identity
![]()
where ![]() is the so-called fitted value namely
is the so-called fitted value namely
![]() .
The quantity
.
The quantity
![]() is called the Error Sum of Squares and
the quantity
is called the Error Sum of Squares and
the quantity ![]() is called the Regression
Sum of Squares. We get the following ANOVA table.
is called the Regression
Sum of Squares. We get the following ANOVA table.
In this table the P value is used to test ![]() . However, for simple
linear regression it is usually better to use a technique which easily provides confidence
intervals for
. However, for simple
linear regression it is usually better to use a technique which easily provides confidence
intervals for ![]() and can be used to test other values of
and can be used to test other values of ![]() .
.
Let ![]() .and note that because
.and note that because ![]()
![]()
If the errors ![]() are normal so that the
are normal so that the ![]() s are normal then
s are normal then
![]()
is normal and we can compute the mean and variance
of ![]() as follows:
as follows:
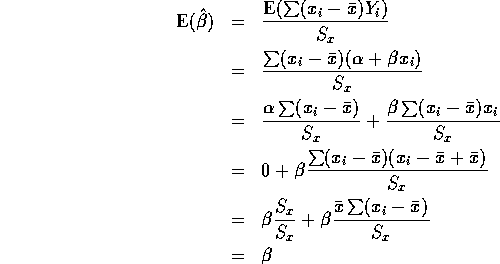
So ![]() is unbiased. Next:
is unbiased. Next:
