![]()
![]()
Reading for Today's Lecture: Chapter 1 of Casella and Berger.
Goals of Today's Lecture:
Course outline:
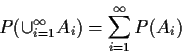
Standard view of scientific inference has a set of theories which make predictions about the outcomes of an experiment:
| Theory | Prediction |
| A | 1 |
| B | 2 |
| C | 3 |
Conduct experiment, see outcome 2: we infer that Theory B is correct (or at least that A and C are wrong).
Add Randomness
| Theory | Prediction |
| A | Usually 1 sometimes 2 never 3 |
| B | Usually 2 sometimes 1 never 3 |
| C | Usually 3 sometimes 1 never 2 |
See outcome 2: infer Theory B probably correct, Theory A probably not correct, Theory C is wrong.
Probability Theory: construct table: compute likely outcomes of experiments.
Statistics: inverse process. Use table to draw inferences from outcome of experiment. How should we do it and how wrong are our inferences likely to be?
Probability Space (or Sample Space): ordered
triple
![]() .
.
Axioms guarantee we can compute probabilities by usual rules, including approximation without fear of contradiction.
Vector valued random variable: function
![]() with the property that,
writing,
with the property that,
writing,
![]()
In almost all of probability and statistics the dependence of a random variable on
a point in the probability space is hidden! You almost always see X not ![]() .
.
Now for formal definitions:
Borel ![]() -field in Rp: smallest
-field in Rp: smallest ![]() -field in Rp
containing every open ball.
-field in Rp
containing every open ball.
Every common set is a Borel set, that is, in the Borel ![]() -field.
-field.
An Rp valued random variable is a map
![]() such that
when A is Borel then
such that
when A is Borel then
![]() .
.
Fact: this is equivalent to
Jargon and notation: we write ![]() for
for
![]() and define the distribution of X to be the map
and define the distribution of X to be the map
Cumulative Distribution Function (or CDF) of X: function FX on Rpdefined by
Properties of FX (or just F when there's only one CDF under consideration) for p=1:
The distribution of a random variable X is discrete
(we also call the random variable discrete) if there
is a countable set
![]() such that
such that
The distribution of a random variable X is absolutely continuous
if there is a function f such that
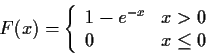
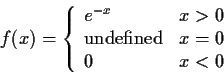
Example: X is exponential.
General Problem: Start with assumptions about the density or CDF of a random
vector
![]() .
Define
.
Define
![]() to be some function
of X (usually some statistic of interest). How can we compute the distribution
or CDF or density of Y?
to be some function
of X (usually some statistic of interest). How can we compute the distribution
or CDF or density of Y?
Univariate Techniques
Method 1: compute the CDF by integration and differentiate to find fY.
Example:
![]() and
and ![]() .
.
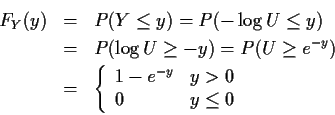
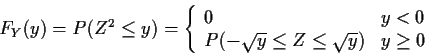
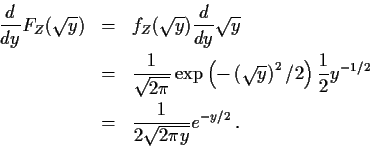
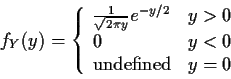
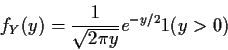
Example:
![]() ,
i.e.
,
i.e.
![\begin{displaymath}f_Y(y) = \left\{ \begin{array}{ll}
0 & y < 0
\\
\frac{d}{dy...
...\right] & y > 0
\\
\mbox{undefined} & y=0
\end{array}\right.
\end{displaymath}](img52.gif)
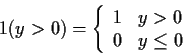
We will find indicator notation useful:
Notice: I never evaluated FY before differentiating it. In fact
FY and FZ are integrals I can't do but I can differentiate then anyway.
Remember fundamental theorem of calculus: