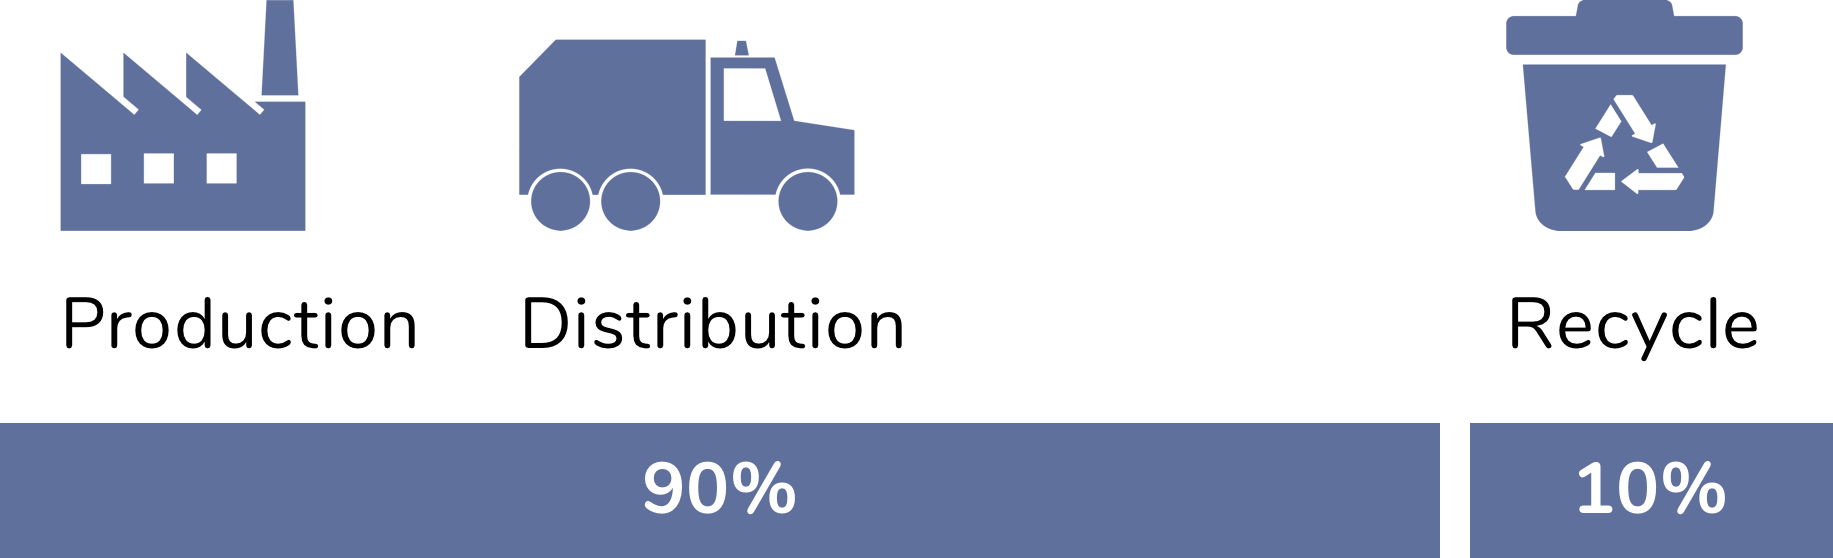
Manufacture vs. waste management
The footprint of consumables and waste is dominated by upstream impacts, namely the energy and materials that go into producing the goods that are consumed in the city. These upstream impacts – the embodied materials and embodied energy associated with the consumables – represent 90% of the consumables footprint.
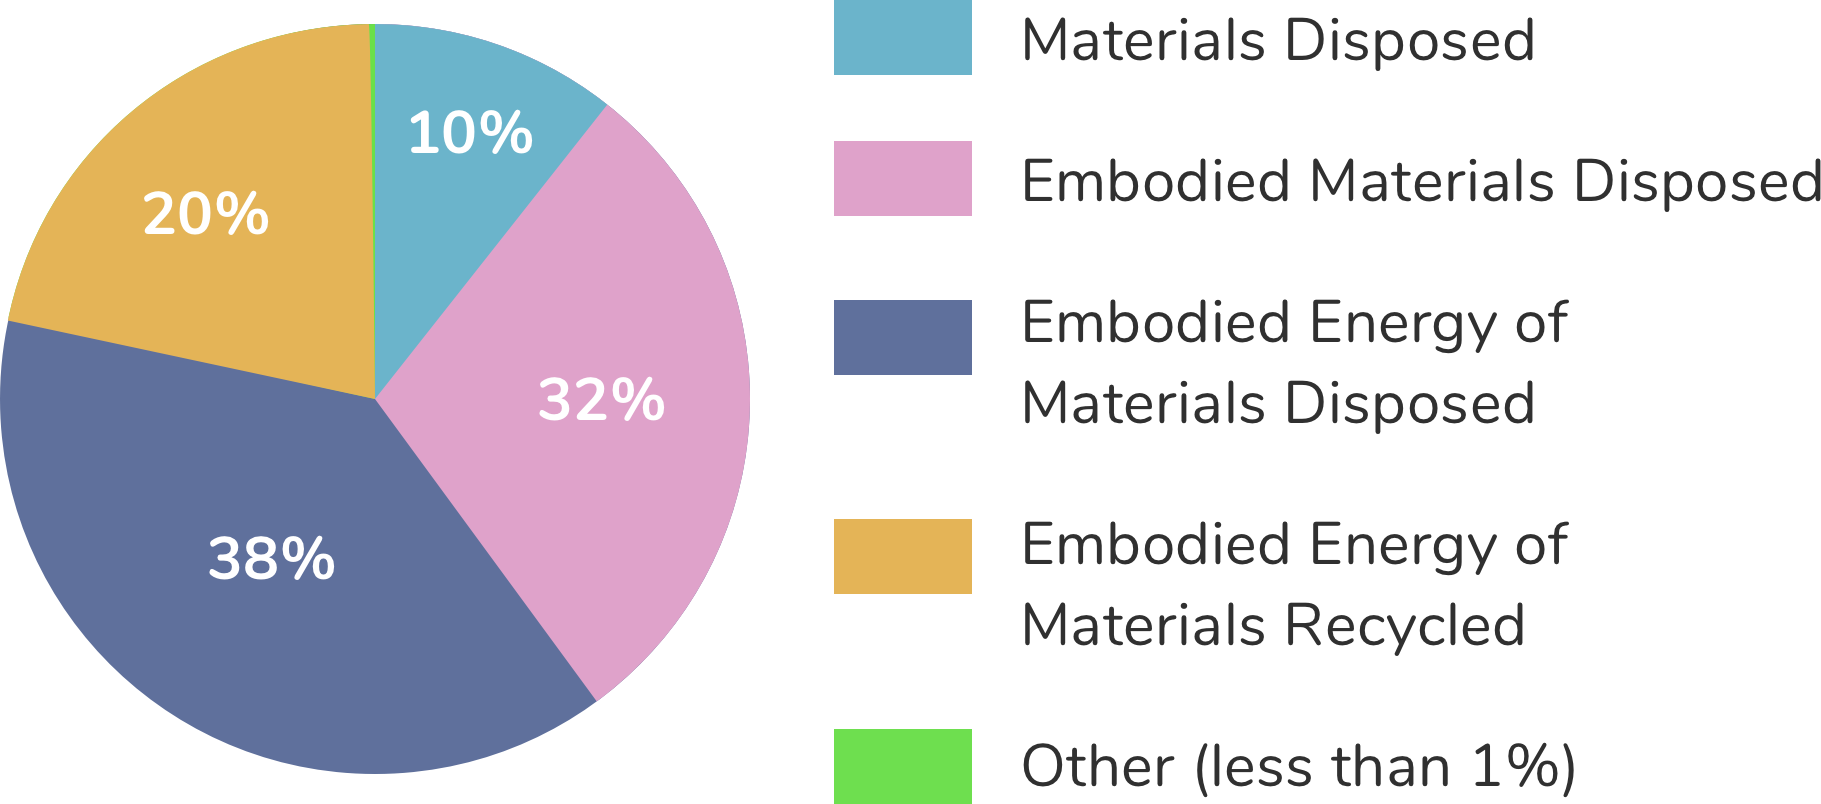
Embodied materials are those that are utilized in the manufacture of a consumable product or infrastructure but do not end up in the finished product; and embodied energy is the energy used in creating and delivering a particular material (e.g., consumable good or infrastructure).
These results suggest a need for a shift in the way we think about consumption. They emphasize the necessity to prioritize reducing overall consumption instead of end of stream waste management.
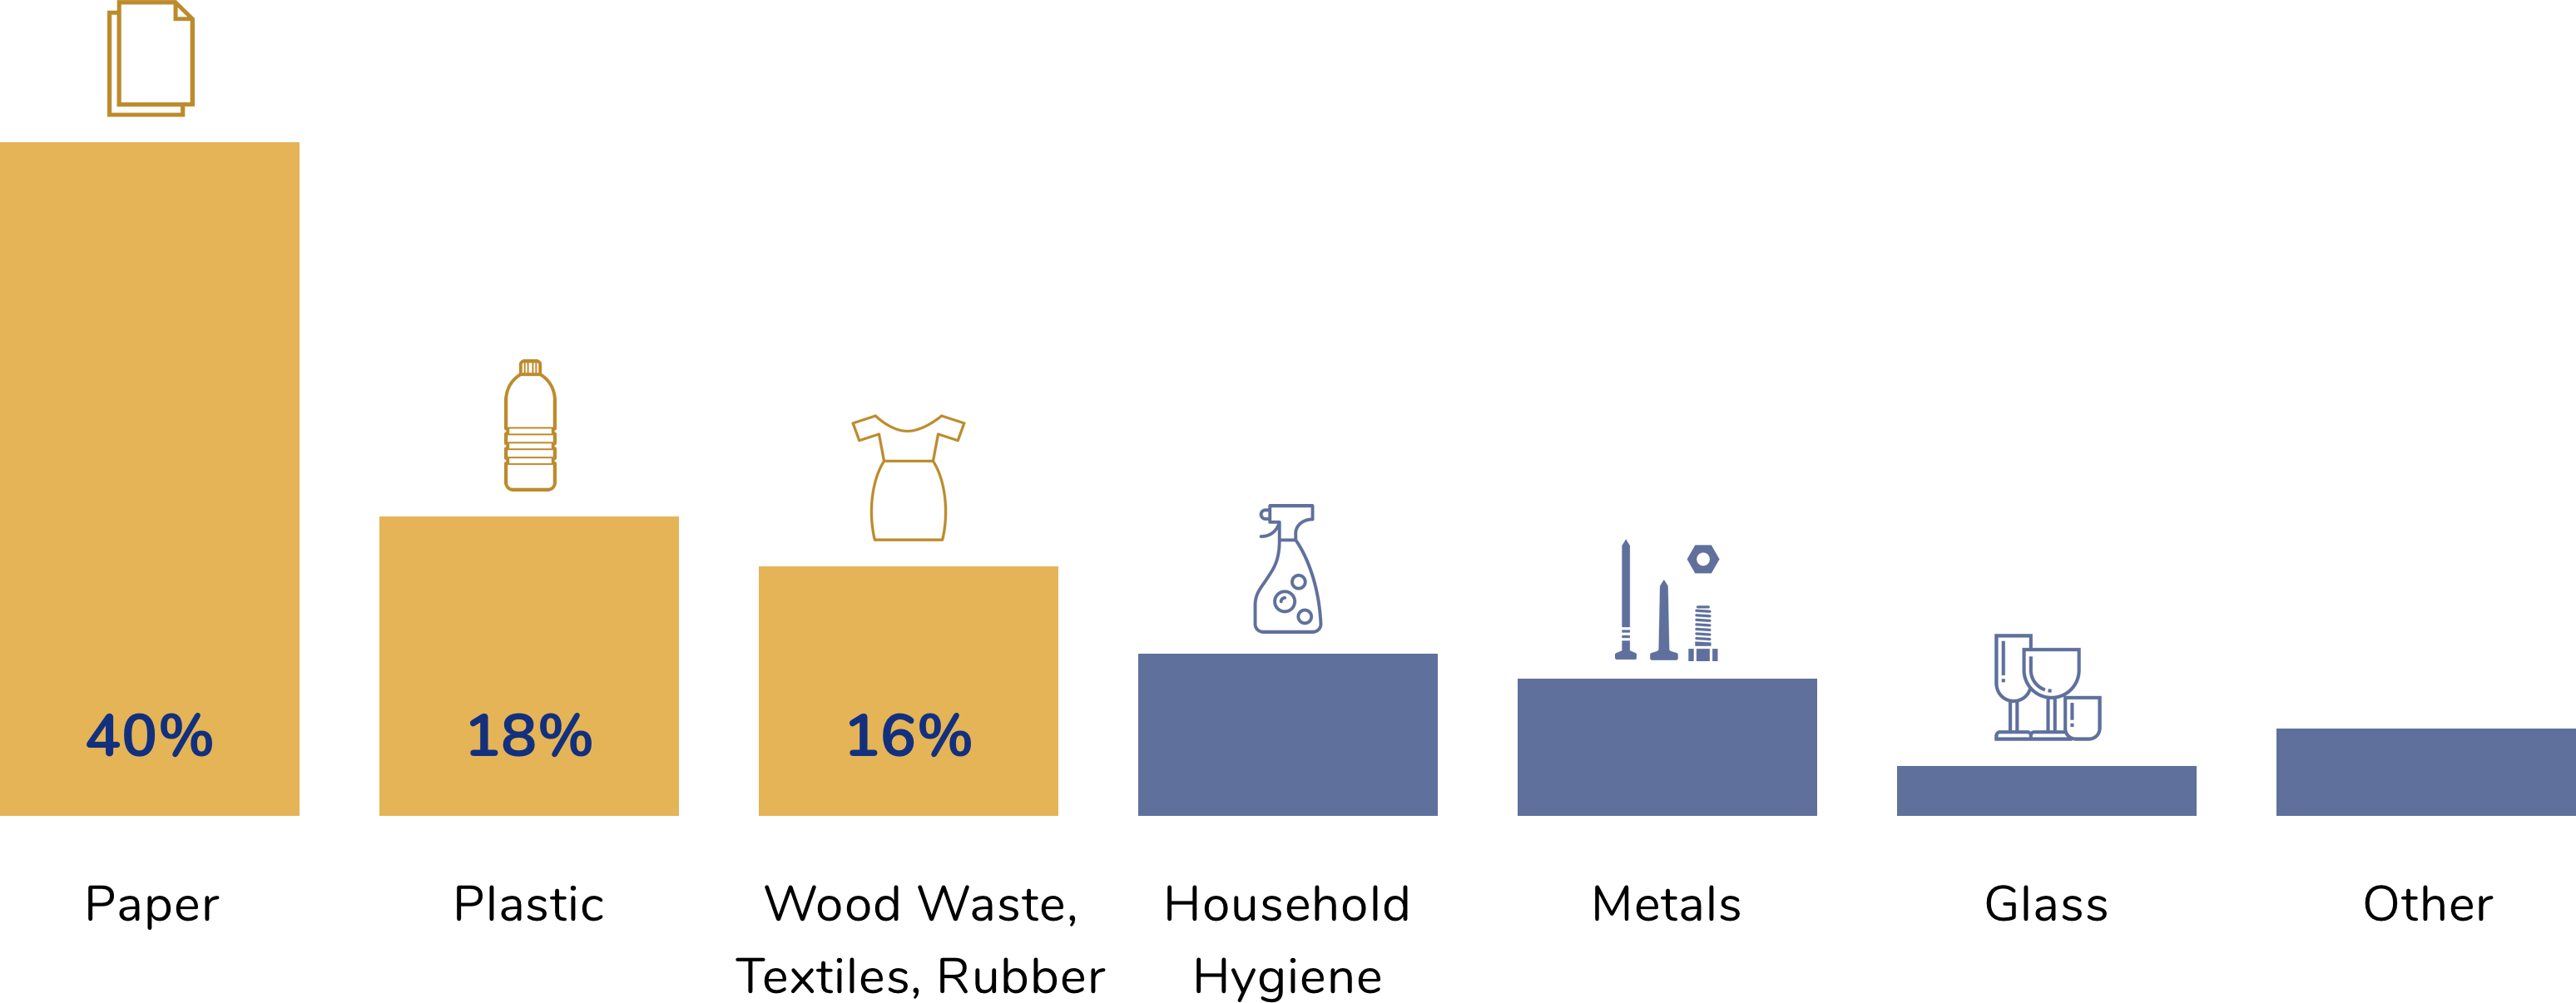
3 Materials Created 74% of Total Footprint