
- Faculty & Staff
- About FASS
- Departments and programs
- Anthropology
- Applied Legal Studies
- Cognitive Science
- Criminology
- Economics
- English
- French
- French Cohort
- Gender, Sexuality, and Women's Studies
- Gerontology
- Global Asia
- Global Humanities
- Graduate Liberal Studies
- Hellenic Studies
- History
- Indigenous Languages
- Indigenous Studies
- International Studies
- Labour Studies
- Linguistics
- Philosophy
- Political Science
- Psychology
- Public Policy
- Social Data Analytics
- Sociology
- Urban Studies
- World Languages & Literatures
- Students
- Research
- News
- Community
- Teaching
- FASS at Surrey
- Make meaning
- Next steps for new students (redirect)
- Convocation
FASS News, Research
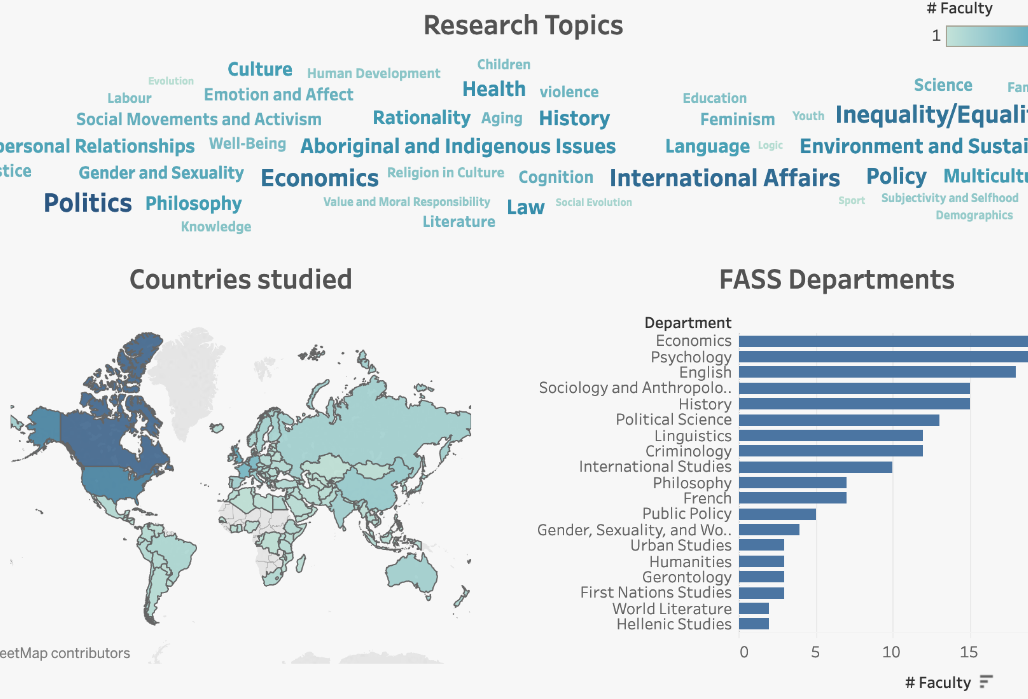
New online tool visualizes FASS research
The Faculty of Arts and Social Sciences (FASS) has over 300 faculty members, most of whom are active researchers. Getting a handle on what, where and with whom they’re studying, will be possible with the launch of the new Visualizing FASS Research tool.
The tool visualizes the research topics that FASS faculty are focused on, along with:
- the geographic region in which research is focused
- international collaborations they’re part of
- the historical period it focuses on
- community engaged research in Metro Vancouver, Canada and internationally
The FASS Research tool was developed by former Associate Dean Lisa Shapiro and the Vancouver Institute for Visual Analytics (VIVA).
“The project started from the simple question that somebody asked me: what is the research strength of FASS?” Shapiro says. “While I could point to specific departments with strong research, there was no way to identify the research strength of the Faculty as a whole. To answer that question I first needed to know what faculty members were working on, and to categorize that research in a way that was not discipline specific.”
The visualizations of FASS research will directly impact a whole range of constituents and stakeholders. In general, people will be better able to understand the kinds of questions that animate the research of FASS faculty members, pique their own curiosity, and find experts on a particular topic they’re interested in. Community members will be able to see more clearly the outcomes of public investment in post-secondary education.
SFU faculty, both within and outside of FASS, and staff, can find out more about research outside of their units, and discover colleagues with related interests, making multi-disciplinary collaboration easier. Prospective graduate students will be able to find potential supervisors for graduate studies more easily. And undergraduate students can both find the faculty working on topics they’re curious about and discover the research their instructors are undertaking outside the classroom.
As these visualizations prompt further questions from users, new visualizations can emerge to help address them.
Support for Research Visualizations from ViVA:
- Lyn Bartram
- Stan Nowak
- Maha El Meseery
- Abhisekh Patra