Factors
|
Function and Control Points |
Reasons |
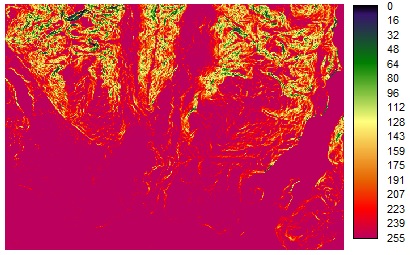
| Slope Degrees |
Monotonically decreasing Sigmodial function; Control points at 10 and 76.9321 |
Area with slope lower than 10 degrees are easier to access and cheaper to construct. Slopes above 10 degrees are just equally unsuitable |
| Land Use Rating |
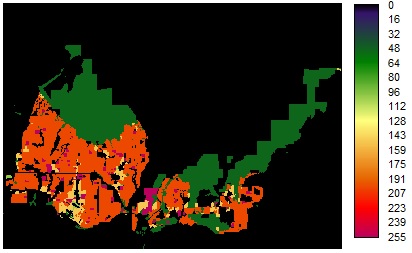
Pre-setup rating of all land use type: institutional=255, single home residential=200, low-rise residential=150, open undeveloped=100, others=0 |
Suitability rating base on accessibility, construction cost and safety. |
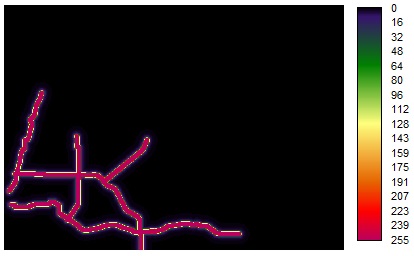
| Distance to Emergency Response Route |
Monotonically decreasing "J-shape" function; Control points at 100 and 500 |
Distance to the emergency response route within 100 m is best for delivering supplies and aid, the accessibility decrease beyond 100 m, 500 m is the mid point of not suitable and perfect suitable. |
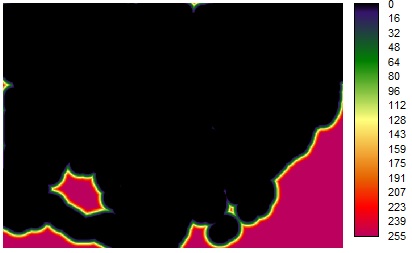
| Distance to Natural Hazard Areas |
Monotonically increasing Sigmodial function; Control points at 500 and 1000 |
Due to safty concern, the further a place is away from the natural hazard areas, the more suitable a place is for building an emergency facility. |
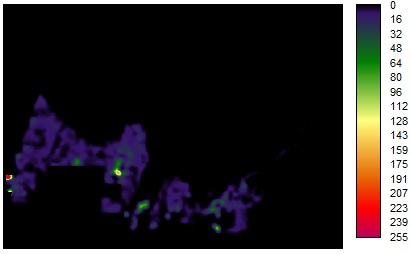
| Population Density |
Monotonically increasing linear function; Control points at o and 22750.8 |
To build a emergency facility in an area with higher population density can serve more people when natural hazards happen. So the suitability increase with population density increase. |