Home - Background - Data Acquisition - Methodology - Spatial Analysis - Problems - Discussion - References
Methodology ______________________________________________________________________________
A Multi-Criteria Evaluation (MCE) using Weighted Linear Combination (WLC) of the data was carried out to locate suitable and unsuitable habitat areas for the Pacific Water Shrew. The criteria necessary to perform a MCE are contraints and factors, contraints being "hard" boolean images that limit the analysis to particular geographic areas, and factors being criteria that indicate some degree of suitability within the geographic area in the analysis. For this MCE, there are two constraints, and nine factors.
Constraints
The two constraints used were the region layer, which shows the extent of the Pacific Water Shrews' potential habitat, and the BC Biogeoclimatic zones of Coastal Douglas Fir, and Coastal Western Hemlock, which are the only zomes that the Pacific Water Shrew inhabits. These layers limit the extent of suitable habitat areas in the study, and are therefore constraints.
The region layer was reclassified into a Boolean image in IDRISI, giving the region a value of 1, and the area outside of the region a value of 0.
The two BC Biogeoclimatic zones were reclassified into two separate Boolean images. They were then combined into one image using the overlay module.
Factors
The nine factors used in this analysis were:
- agriculture
- main parks
- lesser parks
- roads
- water
- old forest
- young forest
- wetlands
- urban areas
Each factor was reclassified into a boolean image. Main Parks was created by overlaying the CanMap park data of provincial parks, national wildlife areas, as well as the parks data from the Ministry of Energy, Mines and Petroleum Resources website. Lesser Parks was created from the CanMap park data of campgrounds and parks or sport field areas, since the are of significance, but not to the degree of the other parks, as campgrounds tend to be busier and developed to a certain degree, depending on what kind of campground it is, and parks or sport field areas tend to be located in an urban setting.
The water data was created by overlaying the stream and water bodies data from the CanMap data. A 60 meter buffer was created around the water, as this is the minimum requirement according to researchers for a Pacific Water Shrew's habitat. This is not included as a constraint because it is a suggested buffer distance, and is not known if it should be wider or not.
The distance module was used on each of these, since distance away from agriculture, urban areas, or roads is of significance (the further away these features are, the more suitable the habitat becomes), as well as distance away from parks, forest, water, and wetlands is of significance (the closer these features are, the more suitable habitat is).
The Cartographic Model for these processes is shown below.
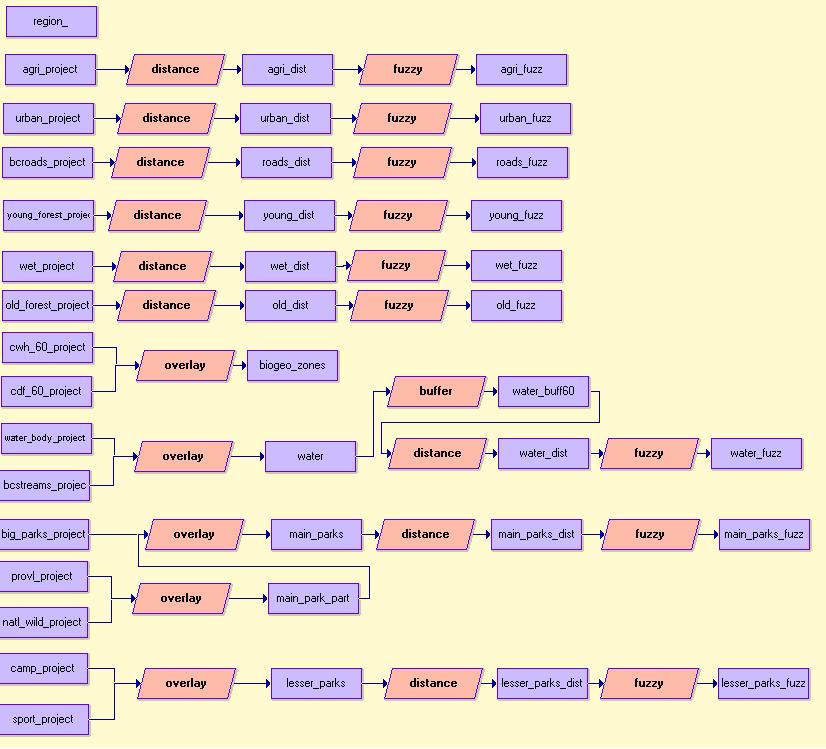
The fuzzy module was used for standardization purposes in byte format (0-255), which allows for data to be continuous on a scale from 0 to 255, where 0 is least suitable and 255 is the most suitable. Using the fuzzy concept enables all locations within the constraints to have some value of suitablility.
The table showing the standardization process for most suitable locations using the fuzzy module is shown below.
| Factor | Membership Function Type | Membership Function Shape | Control Points |
| Agriculture | Monotonically increasing |
J-Shaped | a=0, b=40812.8 |
| Urban Areas | Monotonically increasing | J-Shaped | a=0, b= 30479.5 |
| Roads | Monotonically increasing | J-Shaped | a=0, b=24172.8 |
| Main Parks | Monotonically decreasing | Linear | c=0, d=34883.7 |
| Lesser Parks | Monotonically decreasing | Linear | c=0. d=52751.1 |
| Wetlands | Monotonically decreasing | Linear | c=0, d= 27887.1 |
| Young Forest | Monotonically decreasing | Linear | c=0, d= 24191.6 |
| Old Forest | Monotonically decreasing | Linear | c=0, d= 35544.0 |
| Water | Monotonically decreasing | Linear | c=40, d=24213.9 |
A monotonically increasing function was used for agriculture, urban areas, and roads because as distance away from these areas increases, the more suitable habitat becomes. A monotonically decreasing function was used for the other factors because as distance away from these areas increases, the less suitable habitat becomes.
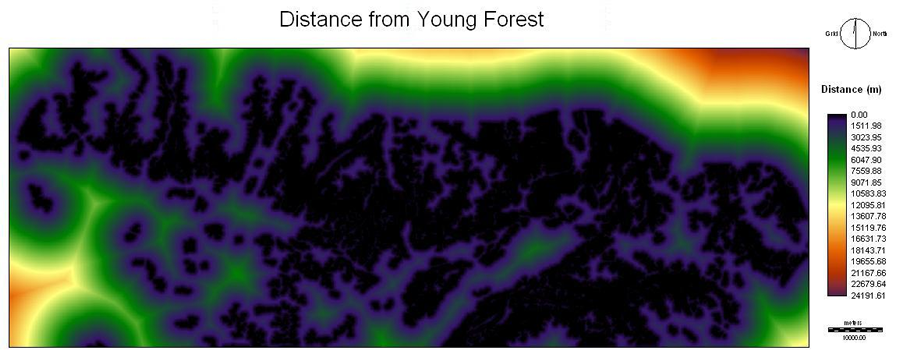
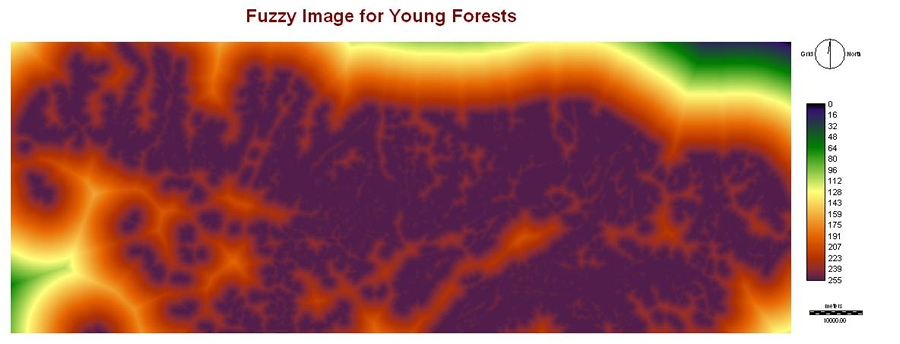
Below are is an example of a resulting distance and fuzzy image produced for young forests. Click here to view the rest.
Jacquelyn Shrimer ~ jshrimer@sfu.ca ~ Geog 355