 
Home
|| Political Parties || Polling Data || Ridings
|| Marginal Seats || Election News || Women
& Elections || Election Laws
2015 Election Results ||Past Elections || Voter Turnout || Standings at Dissolution || Electoral Reform || Links
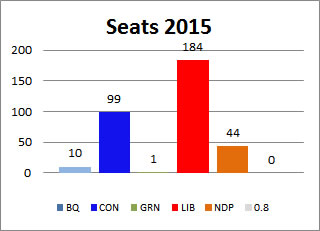
2015 Canadian Election
Results
IMPORTANT NOTE: These results are the final results reported by Elections Canada on February 3, 2016.
2015 Voter Turnout: 68.3%
Detailed election results on a riding-by riding basis are
available at Elections
Canada
* Rounding may result in totals greater than 100%
It is important to note that the electoral map of Canada has changed significantly since the 2011 election. The 2015 election was conducted with 338 electoral districts, compared to 308 ridings in 2011. To make the 2011 results more useful, it is helpful to see how the 2011 results would look like with the new riding boundaries. Elections Canada has calculated what would have happened with the same votes cast at each poll redistributed into the new districts:
Transposition of 2011 results into new electoral districts used in 2015:
| Political affiliation |
2011 Results Using New Boundaries |
2011 Actual Results |
Difference |
| Conservative |
188 |
166 |
22 |
| NDP |
109 |
103 |
6 |
| Liberal |
36 |
34 |
2 |
| Bloc Québécois |
4 |
4 |
0 |
| Green Party |
1 |
1 |
0 |
| Others |
0 |
0 |
0 |
| All parties |
338 |
308 |
30 |
Recent Election Results
| |
 |
 |
 |
 |
 |
OTHER |
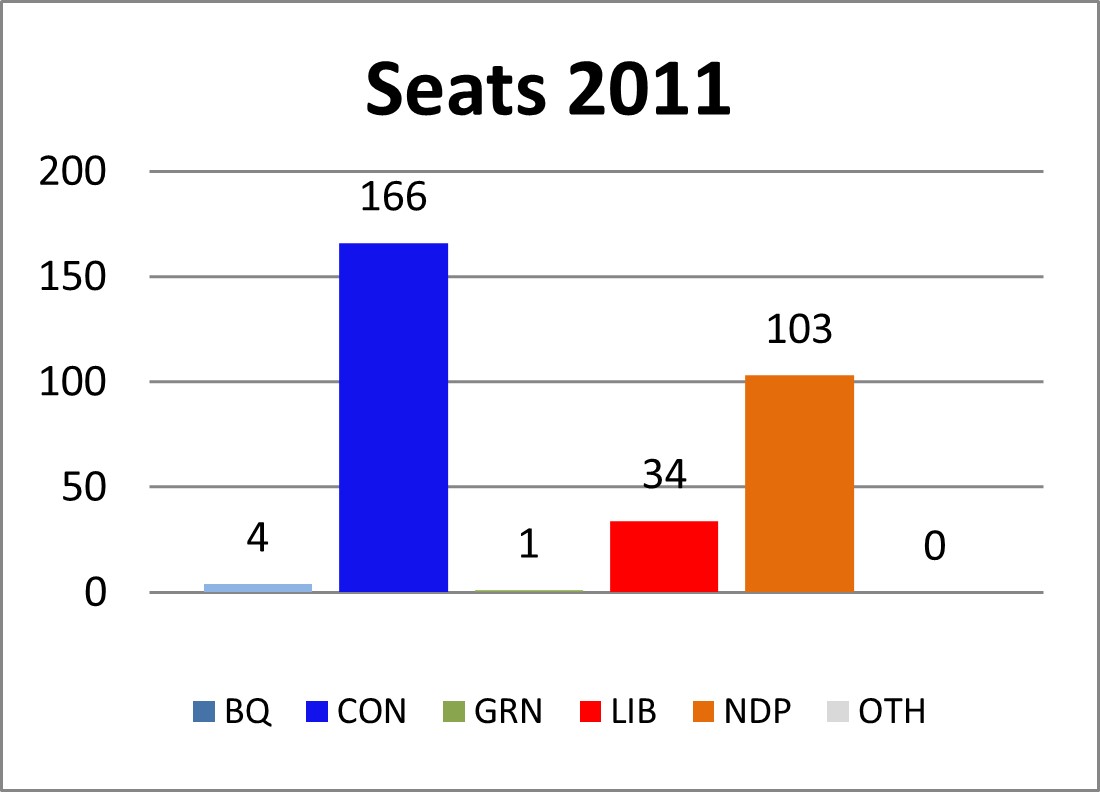
2011
Seats
% Votes |
4
6.0 |
166
39.6 |
1
3.7 |
34
18.9 |
103
30.6 |
0
0.9 |
2008
Seats
% Votes |
49
10.0 |
143
37.6 |
-
6.8 |
77
26.2 |
37
18.2 |
2
1.2 |
2006
Seats
% Votes |
51
10.5 |
124
36.3 |
-
4.5 |
103
30.2 |
29
17.5 |
1
1.0 |
Most Recent Polls Prior to 2015 Election
Link to
Poll
(sponsors
below) |
Polling
Data |
|
|
|
|
|
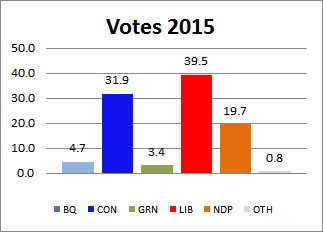
| 2015
Election
Share
of
Votes |
4.7 |
31.9 |
3.4 |
39.5 |
19.7 |
| Forum |
Oct 18
n=1373
error= +/- 3 %
Undecided: n.a. % |
6 |
30 |
3 |
40 |
20 |
| Ekos |
Oct 16-18
n=2122
error= +/- 2.1 %
Undecided: 8.0 % |
4.9 |
31.9 |
5.6 |
35.8 |
20.4 |
| Nanos |
Oct 16-18
n=2400
error= +/- 2.1 %
Undecided: 9.4 % |
5.5 |
30.5 |
4.6 |
39.1 |
19.7 |
| Ipsos |
Oct 15-17
n=2503
error= +/- 2.2 %
Undecided: 5 % |
4 |
31 |
4 |
38 |
22 |
| Leger |
Oct 13-16
n=2086
error= +/- 2.1 %
Undecided: 4 % |
6 |
30 |
4 |
38 |
22 |
| Mainstreet |
Oct 14-15
n=5546
error= +/- 1.46 %
Undecided: 10 % |
4 |
33 |
5 |
38 |
21 |
2011 Election Results
 |
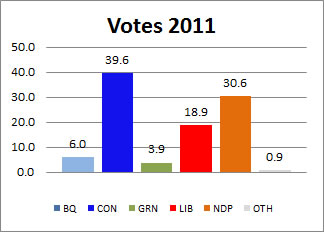 |
2011 voter
turnout: 61.1%
You can compare 2015 & 2011 results with the detailed results for 2008, 2006,
2004, and 2000.
|