Most of the data acquired for this study was retrieved from the City of Surrey Open Data Catalogue
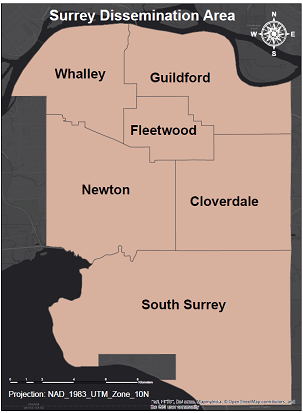
For Dr. Mariana Brussoni’s research on creating a universal Playability scale, her target is to understand playability in the Metro Vancouver region. To narrow down on her research, we chose to focus in on the City of Surrey due to its expanding growth, and readily available data. According to Statistics Canada, the population of Surrey as of 2011 is 468, 251, an increase of 18.6% since 2006. It is a member of the Metro Vancouver regional district. Additionally, Surrey is the third largest City in the province by area, and the second largest city by population. The non minority group population in Surrey makes up approximately 52.6% of the city’s population (Statistics Canada, 2011). Surrey is the most populous city in Canada to be policed by the RCMP, primarily due to the fact crime rates continue to rise in comparison to the previous year (Surrey RCMP Statistics, 2015).
Elements of the Built Urban Environment
Recreation Environment
Looks at the Parks, playgrounds, recreation areas, and schools as safe play areas in the neighbourhood
Transport Environment
Looks at the Sidewalks, streelights, traffic signals, and traffic speed controls as a means of controlling the speed of traffic in the neighbourhood, in order to make a neighbourhood a safer place to walk for children.
Elements of the Social Neighbourhood Environment
Crime
Crime Statistics (Criminal Offences) for the City of Surrey, were used to get an overview of the crime per dissemination area. Crime is generally related to the BUE as features of the BUE can be associated with criminal activity.