Chapter Contents
Previous
Next
|
Chapter Contents |
Previous |
Next |
| Multivariate Analyses |
You can request a plot of the rotated principal components from the Principal Components Rotation Options dialog, shown in Figure 40.7, or from the Component Rotation menu, shown in Figure 40.38.
![[menu]](images/multeq35.gif)
Figure 40.38: Component Rotation Menu
In the menu, you select a rotated component scatter plot ( Scatter Plot), a rotated component biplot with standardized Y variables (Biplot (Std Y)), or a rotated component biplot with centered Y variables ( Biplot (Raw Y)).
In a component rotation plot, the data points are displayed in a scatter plot of rotated principal components. With the approximated Y variable axes also displayed in the scatter plot, the data values of the Y variables are graphically estimated, as described previously in the "Principal Component Plots" section.
Figure 40.39 shows a biplot of the rotated first two principal components with standardized Y variables. The biplot shows that the variable SEPALWID (highlighted axis) has a high correlation with RT2 and that the other three Y variables all have high correlations with RT1.
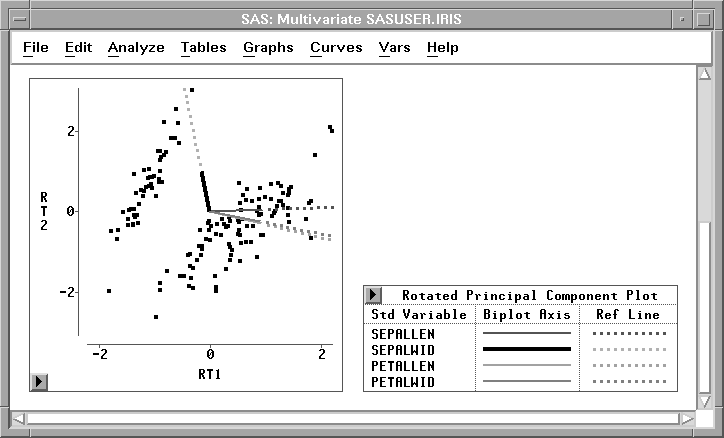
Figure 40.39: Rotated Principal Component Biplots
|
Chapter Contents |
Previous |
Next |
Top |
Copyright © 1999 by SAS Institute Inc., Cary, NC, USA. All rights reserved.