Chapter Contents
Previous
Next
|
Chapter Contents |
Previous |
Next |
| EWMACHART Statement |
| See MACEW3 in the SAS/QC Sample Library |
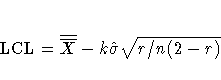
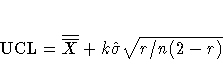
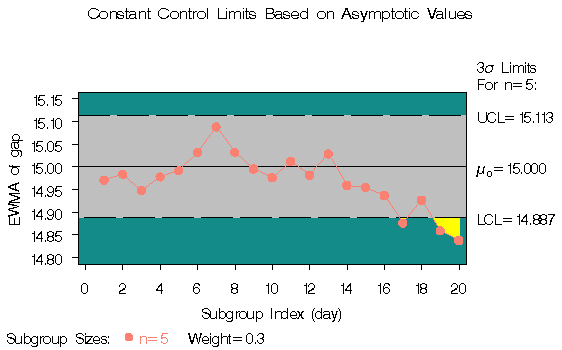
The upper (lower) control limits in Output 20.1.1 are monotonically increasing (decreasing). As the number of subgroups increases, the control limits approach the following asymptotic values:
These constant limits are displayed if you specify the ASYMPTOTIC option,
as illustrated by the following statements:
   title 'Constant Control Limits Based on Asymptotic Values';
   symbol v=dot c=salmon;
   proc macontrol data=clips1;
      ewmachart gap*day /
          mu0      = 15
          sigma0   = 0.2
          weight   = 0.3
          xsymbol  = mu0
          asymptotic
          cframe   = vibg
          cinfill  = ligr
          coutfill = yellow
          cconnect = salmon;
    run;
The chart is shown in Output 20.2.1.
Output 20.2.1: Asymptotic Control Limits
|
|
Chapter Contents |
Previous |
Next |
Top |
Copyright © 1999 by SAS Institute Inc., Cary, NC, USA. All rights reserved.