Chapter Contents
Previous
Next
|
Chapter Contents |
Previous |
Next |
| BOXCHART Statement |
The following notation is used in this section:
| process mean (expected value of the population of measurements) | |
| process standard deviation (standard deviation of the population of measurements) | |
| mean of measurements in i th subgroup | |
| ni | sample size of i th subgroup |
| N | the number of subgroups |
| xij | j th measurement in the i th subgroup, j = 1,2,3 ... , ni |
| xi(j) | j th largest measurement
in the i th subgroup:
|
| weighted average of subgroup means | |
| Mi | median of the measurements in the i th subgroup:
|
| average of the subgroup medians:
| |
| median of the subgroup medians. Denote the
j th largest median by
M(j) so that | |
| eM(n) | standard error of the median of n independent, normally distributed variables with unit standard deviation (the value of eM(n) can be calculated with the STDMED function in a DATA step) |
| Qp(n) | 100p th percentile (0<p<1) of the distribution of the median of n independent observations from a normal population with unit standard deviation |
| zp | 100p th percentile of the standard normal distribution |
| Dp(n) | 100p th percentile of the distibution of the range of n independent observations from a normal population with unit standard deviation |

|
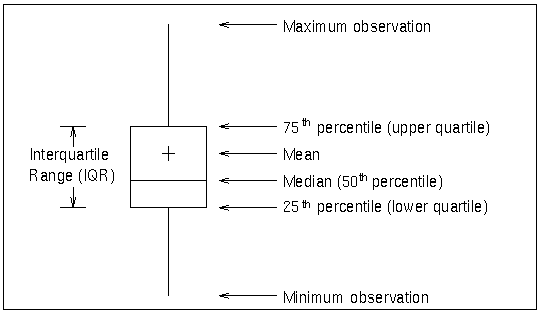
The skeletal style of the box-and-whisker plot shown in Figure 32.12 is the default. You can specify alternative styles with the BOXSTYLE= option; see Example 32.2 or the entry for the BOXSTYLE= option.
The CONTROLSTAT= option specifies whether control limits are computed for subgroup means (the default) or subgroup medians. The following tables provide the formulas for the limits:
Table 32.23: Control Limits and Central Line for Box Charts| CONTROLSTAT=MEAN | CONTROLSTAT=MEDIAN |
| LCLX = lower limit | LCLM = lower limit |
| Central Line | Central Line |
| UCLX = upper limit | UCLM = upper limit |
| CONTROLSTAT=MEAN | CONTROLSTAT=MEDIAN |
| LCLX = lower limit | LCLM = lower limit |
| Central Line | Central Line |
| UCLX = upper limit | UCLM = upper limit |
In the preceding tables, replace ![]() with
with ![]() if you specify MEDCENTRAL=AVGMEAN in addition to CONTROLSTAT=MEDIAN.
Likewise, replace
if you specify MEDCENTRAL=AVGMEAN in addition to CONTROLSTAT=MEDIAN.
Likewise, replace ![]() with
with ![]() if you specify MEDCENTRAL=MEDMED in addition to CONTROLSTAT=MEDIAN.
If standard values
if you specify MEDCENTRAL=MEDMED in addition to CONTROLSTAT=MEDIAN.
If standard values ![]() and
and ![]() are available
for
are available
for ![]() and
and ![]() , replace
, replace ![]() with
with
![]() and
and ![]() with
with ![]() in Table 32.23 and Table 32.24.
in Table 32.23 and Table 32.24.
Note that the limits vary with ni. The formulas for median limits assume that the data are normally distributed.
You can specify parameters for the limits as follows:
Note: You can suppress the display of the control limits with the NOLIMITS option. This is useful for creating standard side-by-side box-and-whisker plots (in this case, the STDDEVIATIONS option is also recommended).
|
Chapter Contents |
Previous |
Next |
Top |
Copyright © 1999 by SAS Institute Inc., Cary, NC, USA. All rights reserved.