Home
|| Political Parties || Polling Data || Ridings
|| Marginal Seats || Election News || Women
& Elections || Election Laws 2011 Canadian Election Results
IMPORTANT UPDATE: These results include the judicial recount in Montmagny--L'Islet--Kamouraska--Rivière-du-Loup, QC, which declared the NDP candidate the winner instead of the Conservative who had been declared elected on election night. Three other recounts were also conducted without changing the winner.
2011Official Voter Turnout: 61.1%
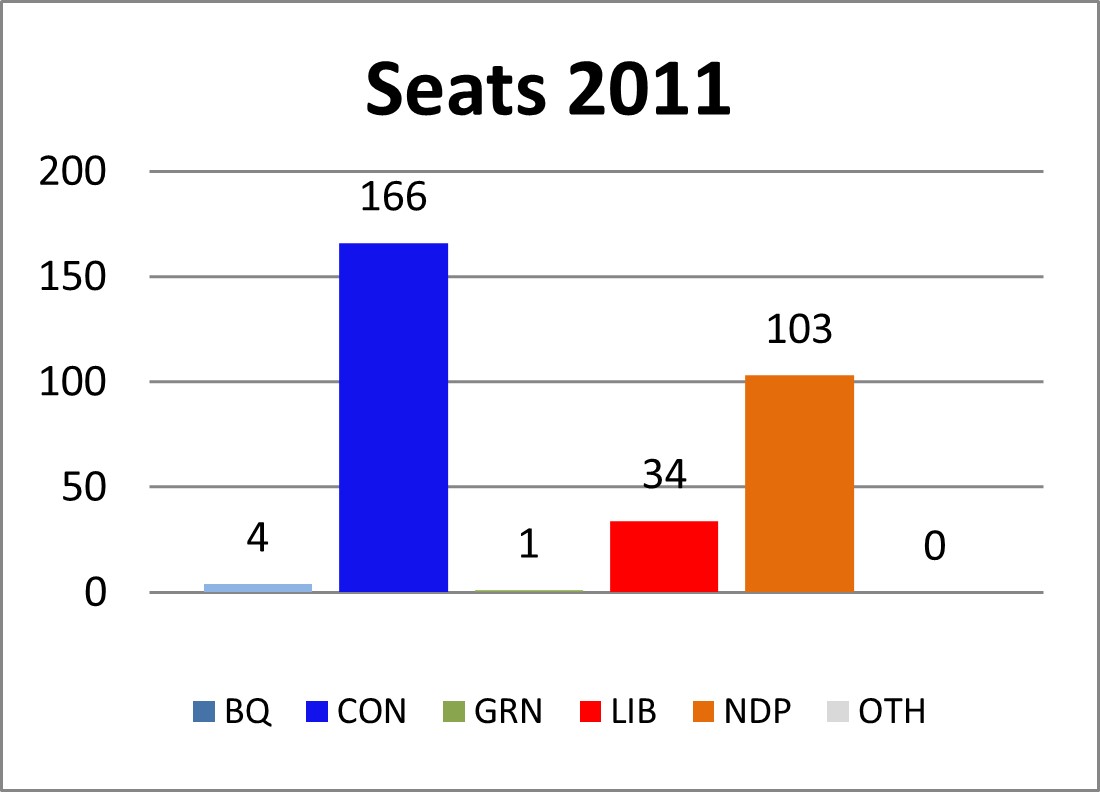
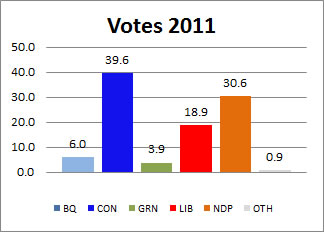
Note: Since Ekos and Democratic Space predictions are given as a range, the mid-points are entered in this table Closest races in 2011 François Lapointe (NDP) - Montmagny--L'Islet--Kamouraska--Rivière-du-Loup, QC - won by 9 votes (0.02% margin) after a judicial recount. Election night results placed his opponent Bernard Généreux (CON) in first place by 100 votes, but this was reversed to a 5 vote victory by Lapointe (0.01% margin) when the results were by validated. The judicial recount that followed was held automatically. Jay Aspin (CON) - Nipissing--Timiskaming, ON - won by 14 votes (0.03% margin) on election night; Anthony Rota (LIB) finished second.. A judicial recount confirmed Aspin as the victor by a 18 vote margin (0.04%). Ted Opitz (CON) - Etobicoke Centre, ON - a judicial recount confirmed Opitz won by 26 votes (0.05% margin). He was declared the winner on election night by 25 votes (0.05% margin); Boris Wrzesnewskyj (LIB) finished second. Kevin Lamoureux (LIB) - Winnipeg North, MB - won by 45 votes (0.18%) in the election night tally; Rebecca Blaikie (NDP) finished second. A judicial recount is not automatic when the margin is more than 0.1%, but it was requested in this case by an elector. The judicial recount confirmed Lamoureux as winner, by 44 votes (0.17%). Counting ballots and verifying results On election night, the ballot papers are counted one at a time. When all the ballots are counted for one polling station, the results are submitted electronically to Elections Canada. These are broadcast to the public as they come in. When all the ballots are counted on election night, these totals are known as the "preliminary results". Over the next seven days the process of verifying the results occurs. In each riding, the totals for every polling stations are checked and added up once more, before being submitted to Elections Canada; these are known as the "validated results." In very close contests, recounts of each ballot paper can be undertaken. Judicial recounts are mandatory in ridings where the winning margin is less than 0.1% of the total valid votes cast. For example, in a riding where 100,000 valid votes were counted, a judicial recount will be held if the winning margin is less than 100 votes; for more information, consult the Elections Canada fact sheet on what happens after electors vote or the Manual on Judicial Recounts. Recounts can also be requested by anyone who asserts that ballots were improperly counted or rejected. The period in which recounts are held can take a few days or weeks to complete. When all the judicial recounts are completed and the final appeals are disposed of, Elections Canada issues the "official results"; these results are usually published 2 or 3 months after election day. Some oddities about the electoral system in 2011 The whimsies of Canada's single member plurality electoral system produced some rather strange results in the 2011 election. For example, Quebec voters contributed 36% of the total votes cast for the NDP across Canada, but Quebec MPs will comprise 57% of the NDP's national caucus. The Bloc Quebecois suffered a battering akin to the Progressive Conservatives in 1993. The BQ's seats were reduced by almost 92%. While almost 1 in 4 Quebecois voted BQ, only 1 in 20 of Quebec's MPs are BQ. Both the Conservatives and Liberals received significantly fewer votes than the BQ but won more seats in Quebec, 6 and 7 respectively. (It should be noted that the BQ had previously benefited from the electoral system, winning a far higher share of the seats than votes in every election since 1993.) The Conservatives increased their share of the Ontario vote by 5 percentage points but saw their share of the seats grow by 20 percentage points. The NDP increased their share of the vote in Manitoba, but their number of seats was cut in half. The NDP set a record of sorts for 21st century elections, in winning almost a third of the votes in Saskatchewan without winning a single seat. For information about alternative electoral systems, see the electoral reform section of this site.
Note: These results include the judicial recount in Brossard - La Prairie (QC) which declared the Liberal candidate the winner instead of the Bloc Quebecois who had been declared elected on election night.
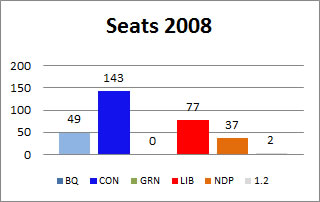
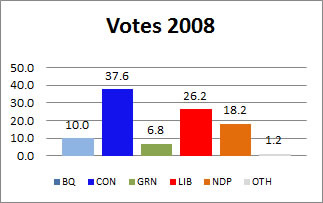
You can compare 2011 results with the detailed results for 2008, 2006, 2004, and 2000.
You can also get detailed election results from several online sources:
|
|||||||||||||||||||||||||||||||||||||||||||||||||||||||||||||||||||||||||||||||||||||||||||||||||||||||||||||||||||||||||||||||||||||||||||||||||||||||||||||||||||||||||||||||||||||||||||||||||||||||||||||||||||||||||||||||||||||||||||||||||||||||||||||||||||||||||||||||||||||||||||||||||||||||||||||||||||||||||||||||||||||||||||||||||||||||||||||||||||||||||||||||||||||||||||||||||||||||||||||||||||||||||