How do I view a grade distribution graph?
Students can view a Grade Distribution Graph (GDG) for individual assignments in the course grade center. This distribution graph shows the mean score, high score, and low score. The mean is the average of the scores in the assignment.
Note your instructor can choose to hide the distribution graph.
Click the check mark to view the grade distribution graph.
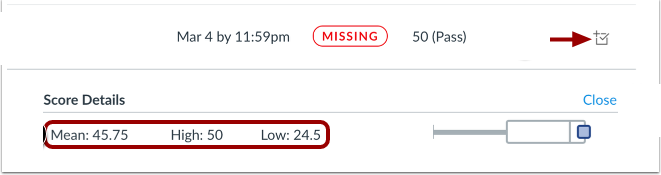
The graph's horizontal line extends from 0 to the assignment's highest possible score. The white box extends from the lowest to the highest student scores. Your score appears as a blue square on this plot.