Background
Pedestrian injury hotspots have the potential to tell a lot about the nature of the urban environment at street level. Pedestrian injury is an area of significant concern for many levels of government due to its potential outcomes; serious injury or fatalities (Larsen et al. 2012). In Canada, there were 400 pedestrian fatalities and 6000 pedestrians seriously injured between 2002-2006 (Miranda-Morena et al.2011). The purpose of this study is to idenitfy areas of Toronto, Ontario that are the most dangerous for pedestrians, and idenitfy why. This study will assess how select features of the built environmnent correlate with pedestrian injury hotspots (Hess, 2009). We use the term hotspots as it has been defined in Schurrman et al (2001), study, as disproportionately high incident locations of pedestrian injury at an intersection.
Virtual Audits
Traditional research methods of spatial and environmental surveillance require physical audits of intersections wjere vehicle-pedestrian accidents are occuring most. The expansion of the web and free geospatial services allow for virtual audits of environmental features. Platforms such as Google Streetview and Bing Streetside offer free virtual scans for the public and have been found to be resource-efficient, and a reliable alternative to physical audits (Badland et al. 2010). Charreire(2014) compared 13 studies that performed environmental and virtual audits and found no significant difference in objective measures. For our study, we will be utilizing Google Streetview to perform visual audits of Toronto.
Audit Criteria
To complete the virtual audits in this project, a list of features of the built environment typically found in road networks were generated. These features were included based on literature that found features of the urban landscape to affect physical activity of motorized, and nonmotorized transportation. They were also included for the possibility that they could contribute to higher incidence of pedestrian injury. Using the features that Schuurman et al. (2009) used in their study to assess environmental features included categories of: contribute to risk, location complexity, land use and safety measures. The features utilized in the study include:
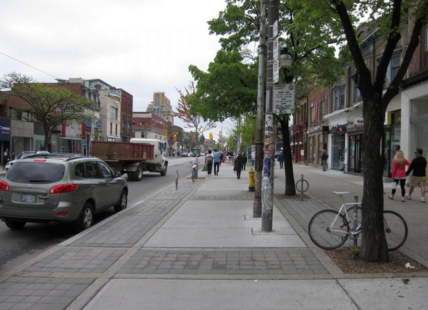
- Long Blocks:
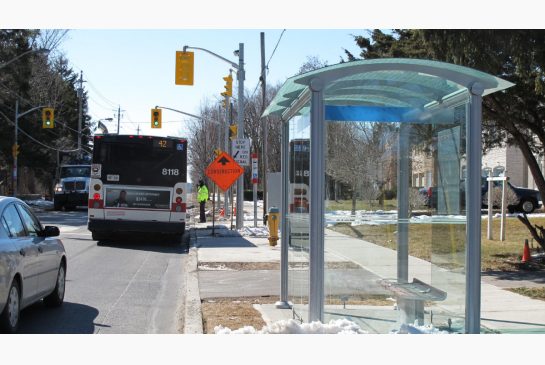
- Bus Stops: A place where a bus regularly stops, marked by signs.
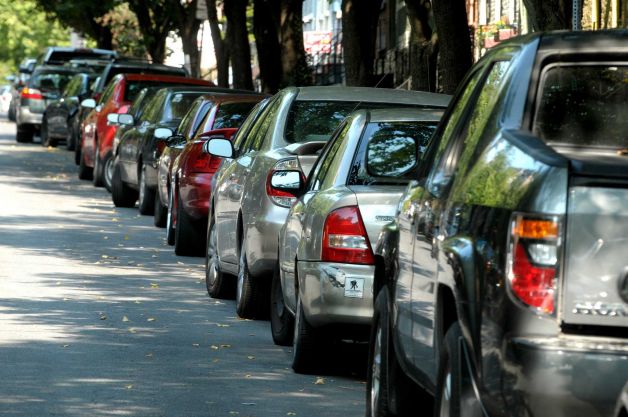
- Curb Parking: Parking located along a concrete border formatting part of the gutter along the edge of the street.
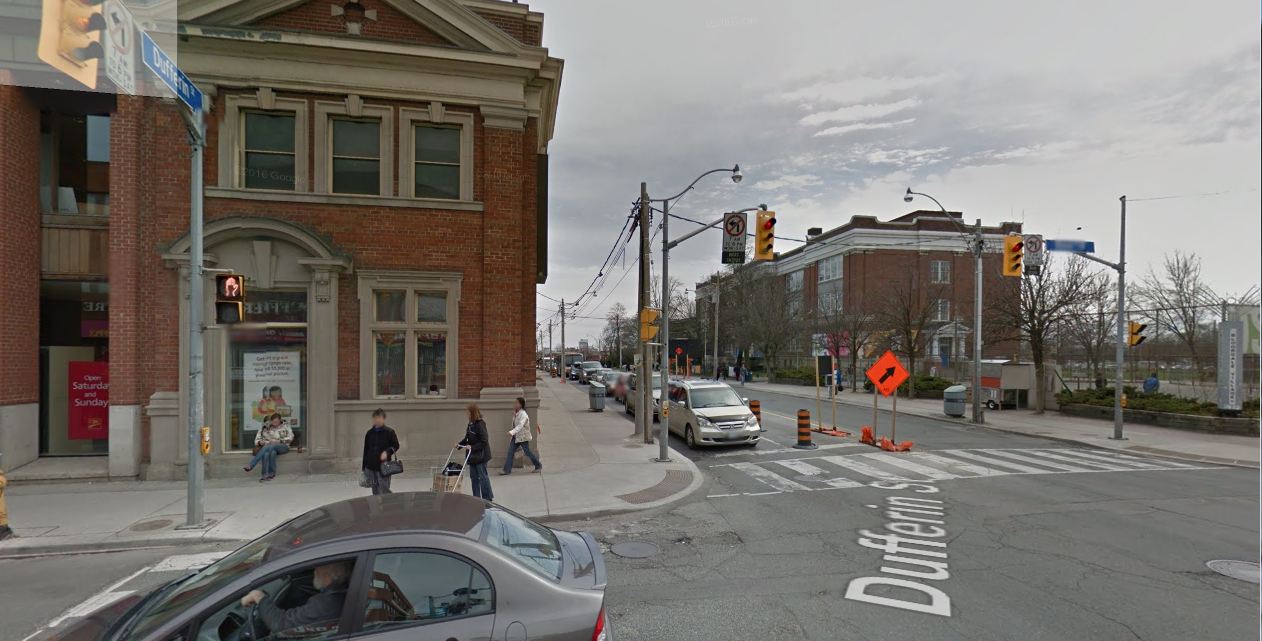
- Cross Walks: A marked part of a road where pedestrians have right of way to cross.

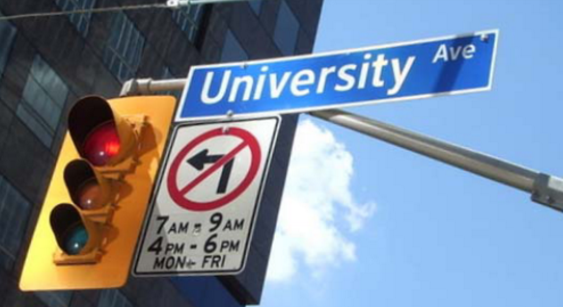
- Signage: Signs collectively, in this case commercial and road traffic signs.

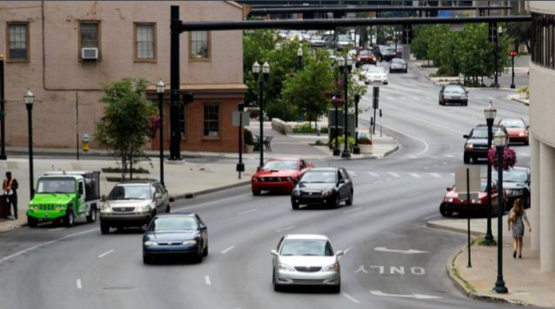
- Number of Lanes: The number of lanes entering the intersection.

- Left and Right Turning Bans: Traffic turning bans that are in effect, sometimes only during certain hours.
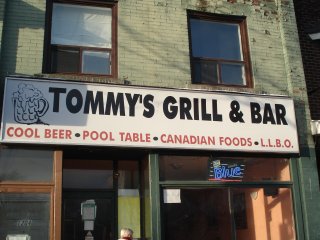
- Bars: Establishments that sell liquor primarily.
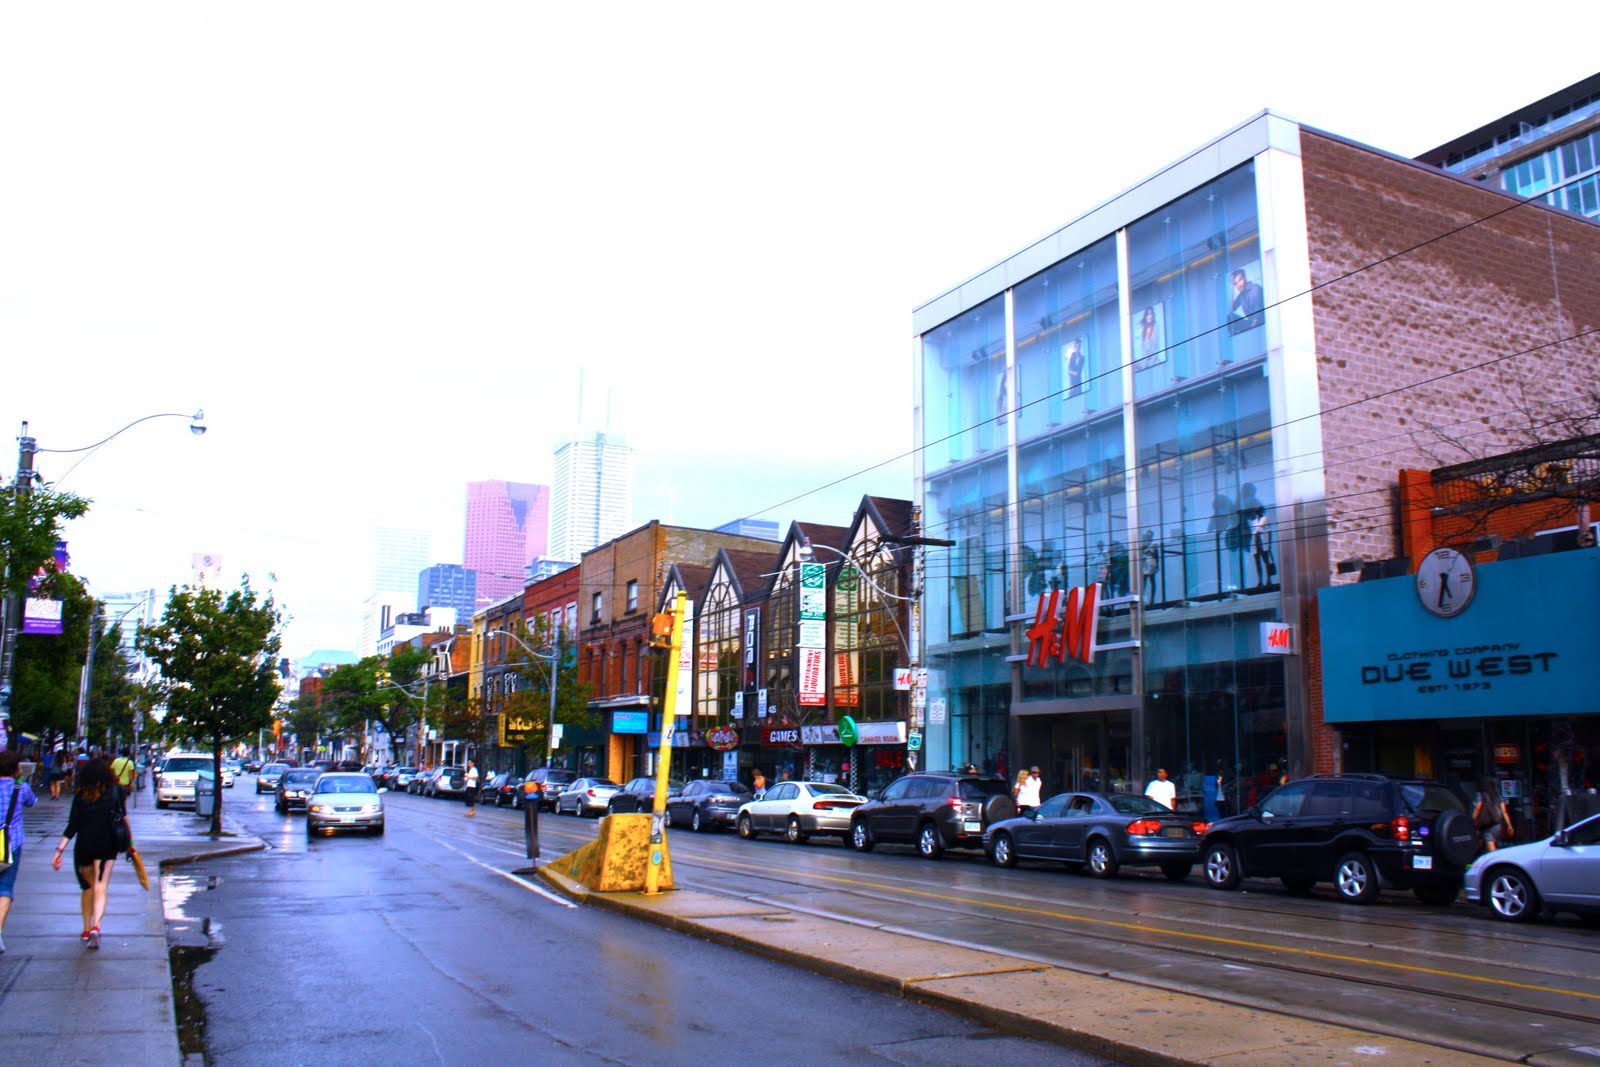
- Retail: Stores that engage in the selling of goods to the public.
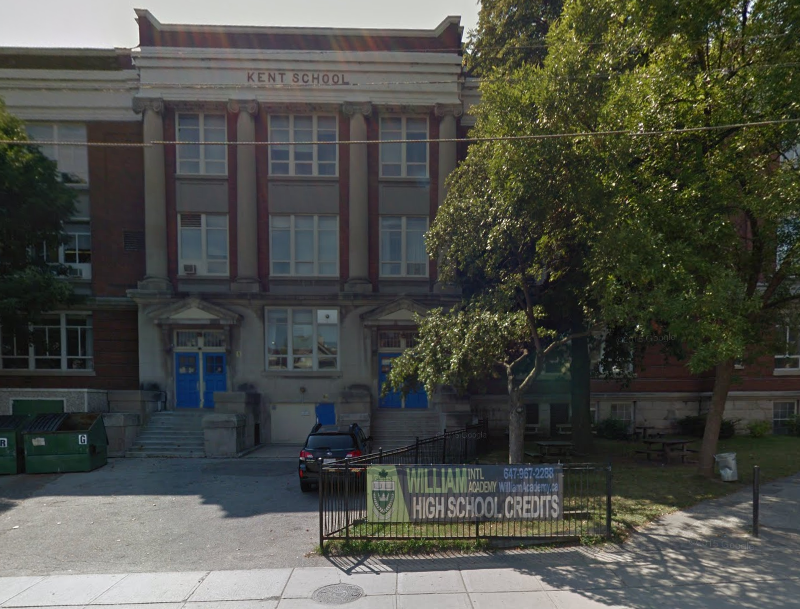
- Schools: Academic institutions, including primary, secondary and post-secondary establishments.
In this project, we added to the list of features included, to add to the quality of the audits. The additional features and rationale for each are as follows:
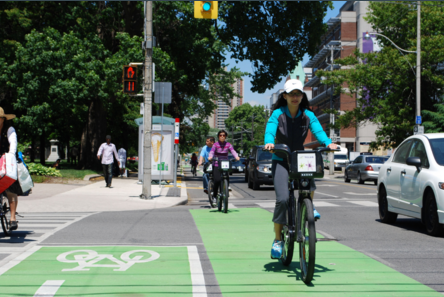
- Bike Lanes: Exclusive traffic lanes for cyclists.
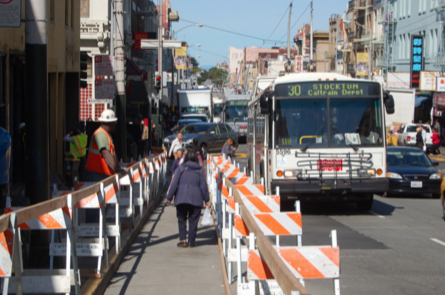
- Construction: Areas that are under maintenance or recieving upgrades.
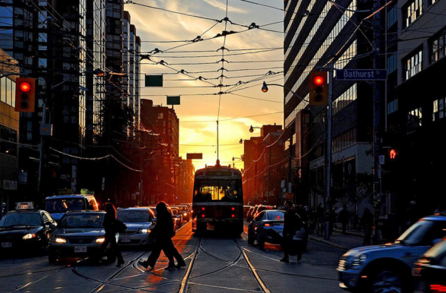
- Transit Hubs: Areas where more than two modes of transportation exist.
- Street Cars: Public vehicles operated on rails along streets of a city.
- One Way Streets: Streets where traffic is limited to travelling in one direction only.
- Wide Sidewalks: Footpath which is larger than the standard 60 inch wide sidewalk.