Methodology
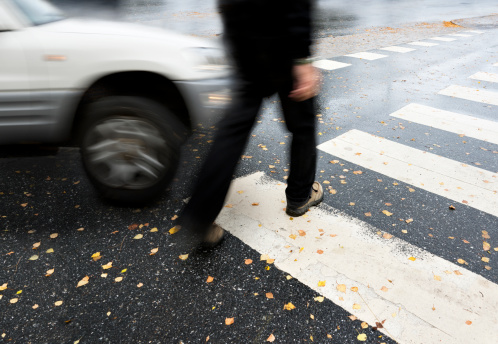
This study used data supplied by the City of Toronto’s Traffic and Safety Unit. The data we received outlined all incidents of pedestrian injuries reported in Toronto from 2010-2014. Incidents were recorded as a single count of pedestrian injury, and were provided along with the street names, date, year, type of person involved, what area of the intersection it occurred, daylight conditions, road surface, visibility conditions and finally the condition of the pedestrian. The total number of accidents analyzed was narrowed down to 35 intersections using a threshold of 11 incidents to define hotspots.
.jpg)
For this project, we utilized virtual audits to interpret the built environment. Audits were completed using the free geospatial service, Google Street View. In using Google Streetview, the auditing process required that the auditors moved around the interactive image of the built environment. This allowed for an in depth analysis of all the study sites as well as an opportunity to review all environmental features at each intersection. The audit observations and comments were reported in an individual excel spreadsheet by each reviewer.
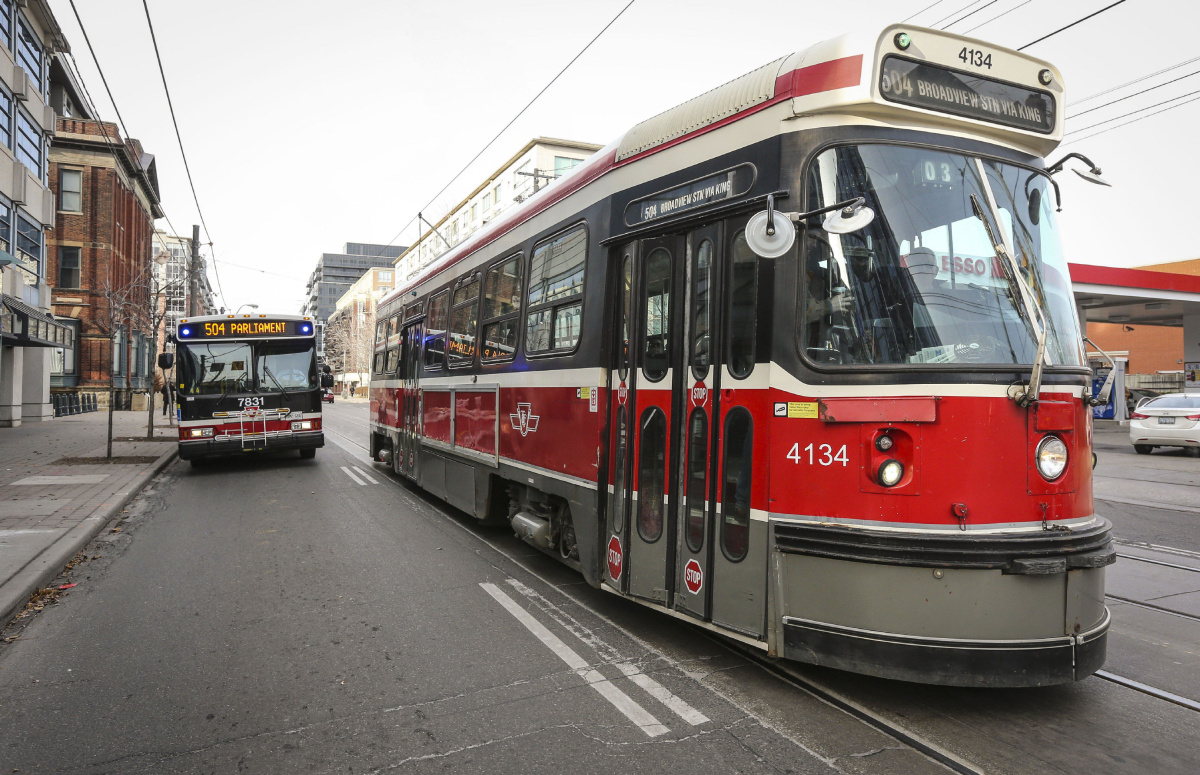
The next step in this analysis was reviewing all of the completed audits. The research team regrouped to discuss and go over every audit result recorded in the individual excel sheets. While most results were in agreeance, there were some differences that arose when going over the results. In particular, the classification of a transit hub had to be defined to do different interpretations. A transit hub, was therefore defined as a mode change between two forms of public transportation at an intersection. Another classification that needed to be delineated was identifying retail space that was set back from the road. Auditors decided that retail had to be located directly on the sidewalks in order to be influential.
See the amalgamated excel sheet here
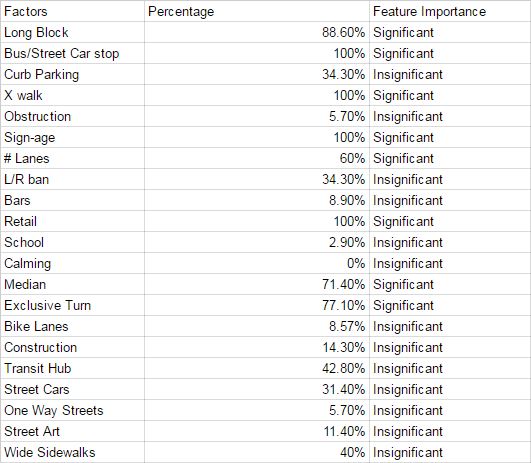
Following the auditing step, each factor was evaluated based on its presence at all intersections. See charts. The research team eliminated factors that were not present at majority of the intersections, which was defined as being 50% present. This reduced the number of features deemed significant down to 8. The remaining features were: long block, bus/streetcar stop, x-walk, sign-age, # lanes, retail, median and excl. turn. The audit results for each intersection were reviewed to check for these factors. When a feature was present it was given a value of 1, and when not present received a zero. Factors such as signage, retail and number of lanes which were measured on a low, medium, high scale were assigned in values of 1, 2 and 3 respectively.