
|
||||
| Project
Home
Introduction
Data
acquisition
Methodology
Spatial
Analysis
Errors/Problems |
| Data
Acquisition |
>Next Page> |
|
Background
research information sources: Greater Vancouver Regional District website: www.gvrd.bc.ca Translink website: www.translink.bc.ca Data
sources: DA
(Dissemination
area) census information Source: I
downloaded
the population data from this source
and convert it into the ArcGIS database. In
ArcGIS, I used this data to calculate the population
density in each
of the dissemination area. After
finished preparing the data in ArcGIS, I imported the finished map of
the
population density into IDRISI and then converted the vector polygons
into raster for analysis purposes (Fig
1). The density is measured in people per square meter. DA
(Dissemination Area) polygon Source:
SIS
lab data folder The DA
polygon is used to create the map of
population density for the City of Translink
transit lines data (buses, peak
hour
buses, skytrain route) Source:
SIS
lab data folder Website:
www.translink.bc.ca The bus
routes, peak hour bus routes, and the
skytrain route data is first prepared in ArcGIS and then imported to
IDRISI. All the vector lines are then converted to raster. Translink
transit data (B-line buses, bus
exchange,
skytrain stations) Source:
Translink website Website:
www.translink.bc.ca Because
the
B-line bus routes, the locations of bus
exchange and skytrain stations are not available anywhere, I digitized
these
data in ArcGIS first and then converted to IDRISI.
(see Figure 2 on the right menu). All the vector points and lines
are then converted into raster. Low
density residential areas and parks
polygons. Source:
SIS
lab data folder These low
density areas and parks polygons are
selected from the landuse polygons of |
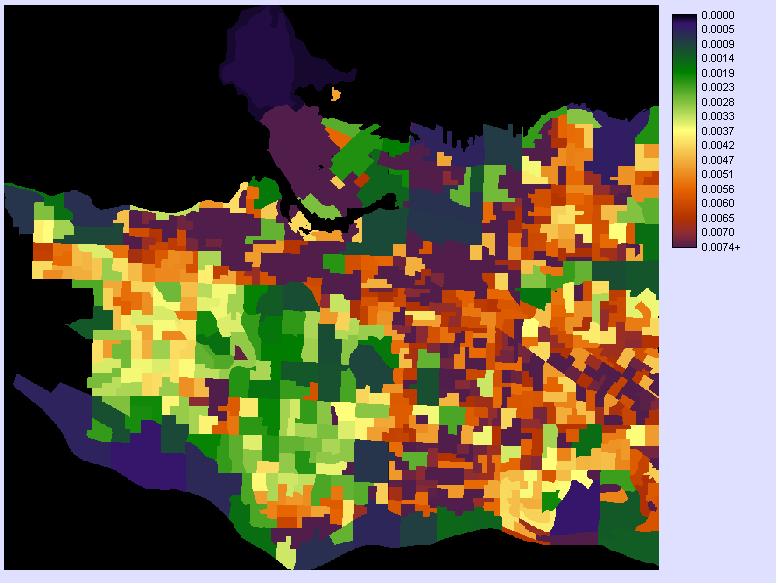 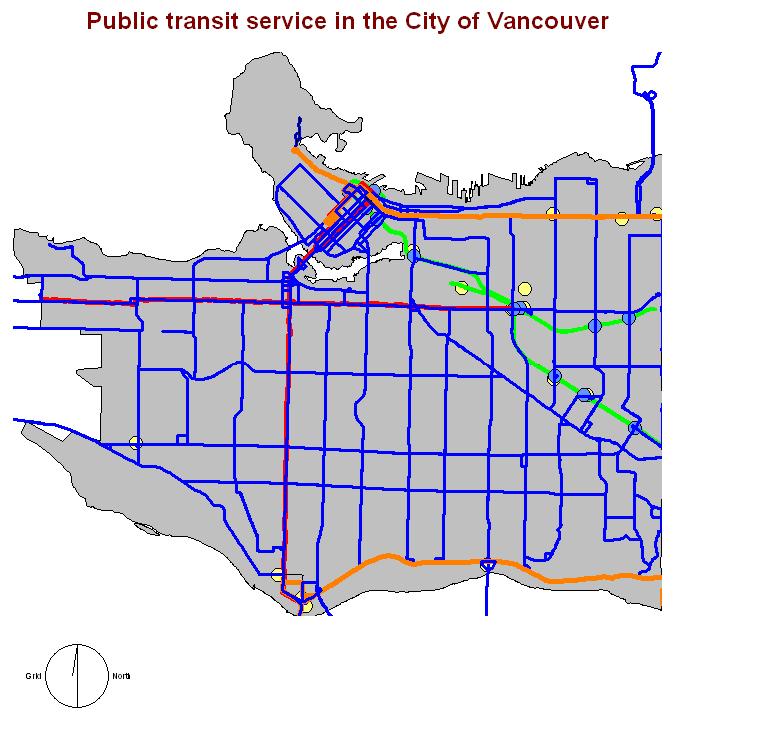 Fig 2.
Translink
transit data I
digitized. Please click on the image above to see a larger
image. Different colours correspond to different mode of
public transit:
Blue lines: conventional buses Purple lines: B-line buses Orange lines: Peak hour buses Yellow dots: Buses exchange Green lines/dots: Skytrain lines and stations. |