
|
||||
| Project
Home
Introduction
Data
acquisition
Methodology
Spatial Analysis
Errors/Problems |
| Methodology |
>Next Page> |
|
All the
analysis in this project was made possible by the use of IDRISI while
the manipulation of data was done by ArcMap. For the purpose of
analysis, raster format was used. To keep things simple, I will
not go into detail of how to convert vector to raster. Below are
some
descriptions of how the spatial analysis was done in IDRISI.
Proximity to public transit The most important factors in this project are the proximity to different transit services. For convenience I called that “Transit Factors” here. The first step in the project is to determine the distances from bus routes, bus exchanges, B-line bus routes, peak hour bus routes, and skytrain stations. Fig 1 shows how I determine the distance from these locations using the “distance” module in the macro modeler in IDRISI. Reclass is sometimes needed before calculating the distance because I want all the public transit maps to be in a Boolean format for easy manipulation. MCE Analysis The resulting maps from the distance determination process generate the continuous surfaces showing the distances from all the transit factors. We can now perform the MCE (Multi-Criteria Analysis). All of these factors were inputted into the Decision Wizard and the constrain for this analysis is the City of The
resulting map from the AHP shows how likely
people will use public transit based on the distance and the
attractiveness of
the type of transit services. Areas that
need improved public transit services The second
purpose of this project is to determine
which areas need improved public transit services.
This
analysis was done in Macro Modeler and Fig
4 shows the macro modeler. Notice
that the modules “group” and “areas” are used here
to determine
the areas that show a low score (low ridership of public transit) in
the
previous MCE analysis. Areas with low
score would be identified as a need of improving transit.
Areas
would be calculated from the groups of
low score. The largest area groups
would
be the communities that need better transit services. Areas
that have potential to concentrate growth. The last
step of the analysis is to determine areas
that are suitable for higher density development. The
factors for this analysis are to have a
community of high transit ridership, with low density population, and
with low
density residential development presently. This
analysis was done in Macro Modeler and Fig
5 shows the
process. The
resulting image shows areas
suitable to convert to higher density development.
|
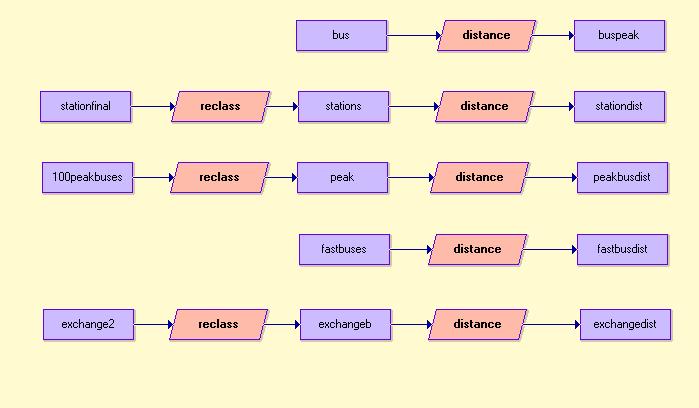 Fig 1 Distance determination from transit using the Macro Modeler 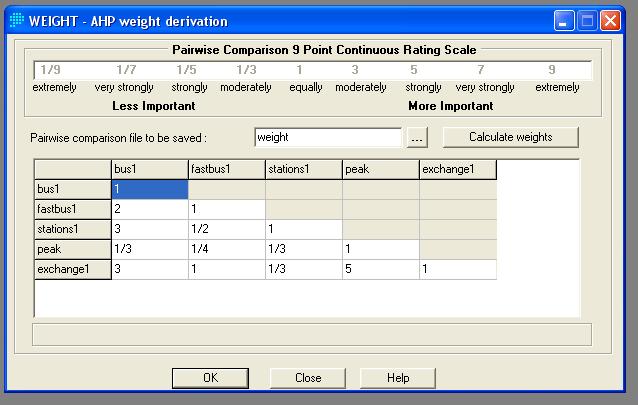 Fig 2. The AHP weighting process. The weighting in this project is relate to the attractiveness of the mode of transit. 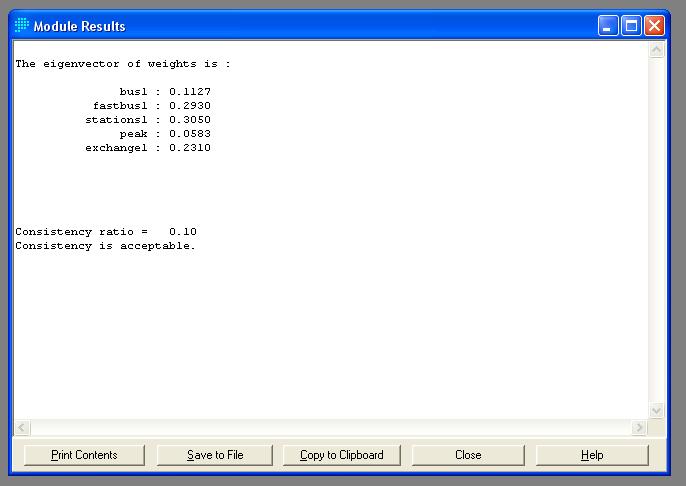 Fig 3. The AHP weighting result 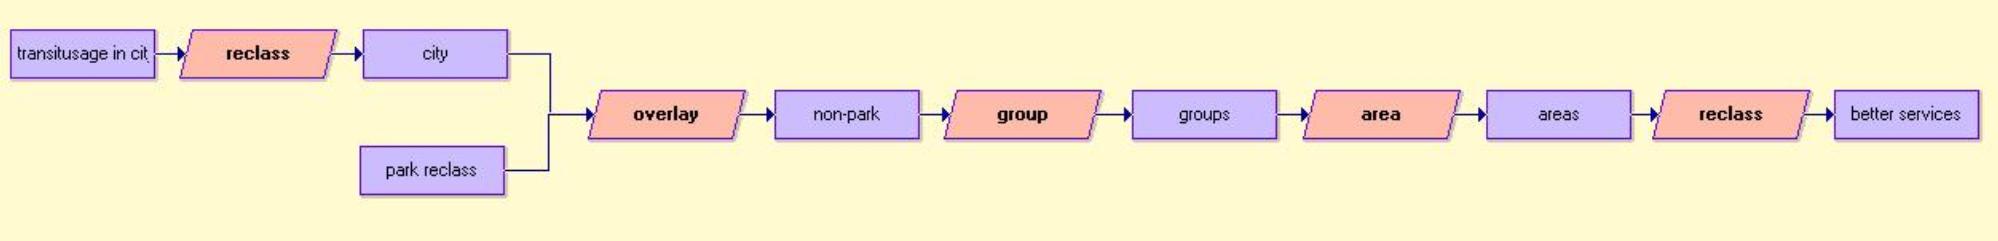 Fig 4. Determining areas that need better transit services in Macro Modeler.  Fig 5. Determining areas suitable for concentrating growth (higher density development) in Macro Modeler. |