|
||||
| Project
Home
Introduction
Data
acquisition Methodology
Spatial
Analysis
Errors/Problems |
| Spatial
Analysis |
>Next Page> |
|
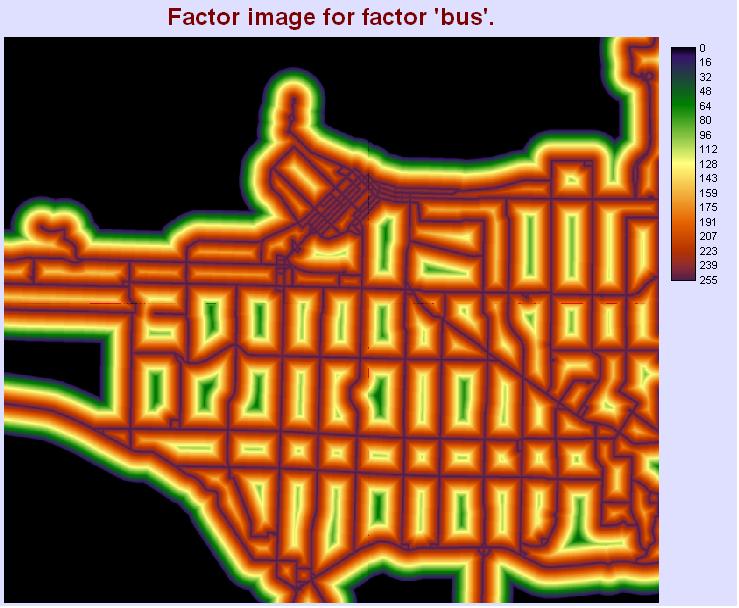
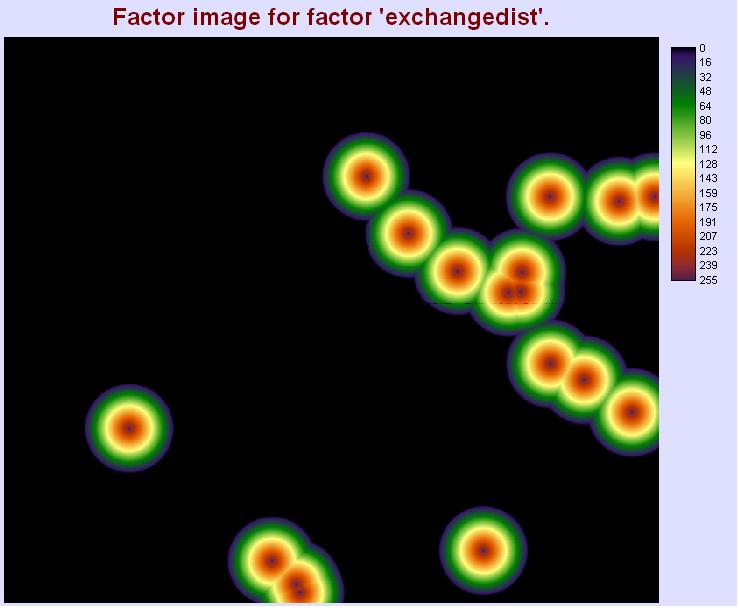
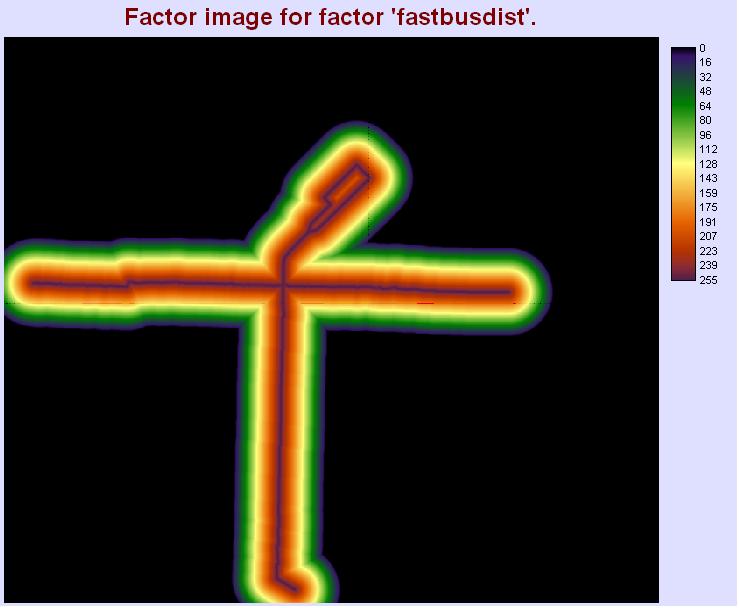
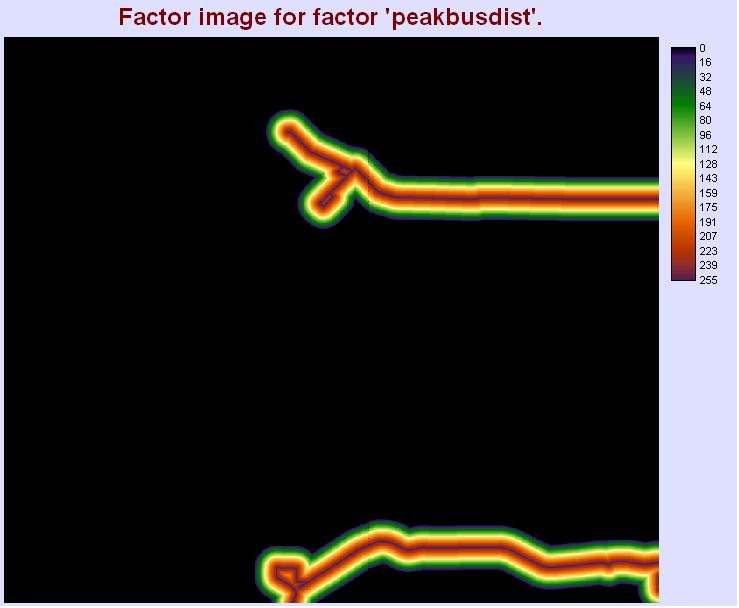
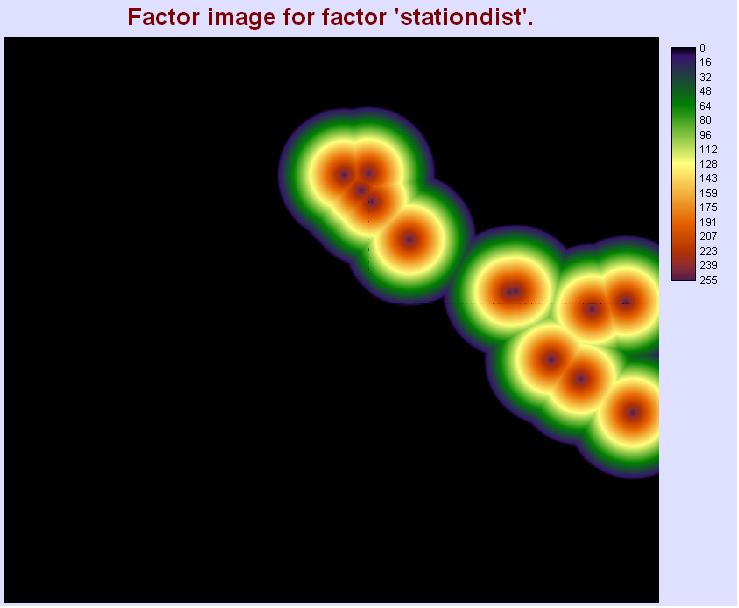
The
MCE Analysis The
images below show the fuzzy factor images generated by
Decision Wizard. Note that I assigned
different factors different values in the monotonically decreasing
linear
function based on the attractiveness of the transit service. The
attractiveness, from the most attractive
to the less attractive, is in the following order:
Skytrain
stations > Bus Exchange = B-Line
Buses > Buses > Peak hour buses. A
larger “d” values are assigned to more attractive services because
people are
more likely to walk longer distance for more attractive services.
Fig
1. Factor
images generated by the MCE analysis. The factors, from left
to right, are: conventional buses factor, bus exchange factor, B-line
buses factor, peak hour buses factor, and skytrain station
factor.
Result
1 -- Transit usage in the City of Vancouver based on distance
and attractiveness of different mode of public transit Then we continue into the AHP analysis. The weighting of each factor can be seen in the “methodology” page of this website. The weighting of each factor is also determined by the attractiveness of each transit service. Fig 2 on the right shows the resulting MCE map. High score indicates areas people more likely to use transit while low score indicates areas people less likely to use transit. Result
2 -- Areas
that need better transit services The third
step is to determine areas that need
better transit services. A score from
0.5 to 23.5 (low score) is identified as areas that need better
services in
order to encourage people to use public transit. After
eliminating park areas, I calculate
areas for each group with low score (the grouping is done with the
module
“group”). Areas larger than 0.6 km2
are determined to be communities that should have priority for
improving
transit services. Fig
3
on the right shows the map of areas that need
better transit services in green. Result
3 -- Areas
suitable for higher population
density growth The last
step of this project is to find areas
suitable for higher density growth because the livable strategic plan
encourages growth within the present urban areas. Park
areas are eliminated because there
should not be any development in parks. High
population density communities are also eliminated
because the
density is already high there. The other
factor being eliminated is the areas with high density residential and
mixed
use areas because they are already higher density development according
to the
strategic plan. Transit usage, however,
should be high (a high scores in the AHP map) because we do not want
everyone
living in a high density neighborhood to be driving.
Combining
all these factors we have the
following map of suitable areas for higher density
development. Fig
4 shows areas
suitable for higher density growth. The result
is obvious. Large pieces of land
along |
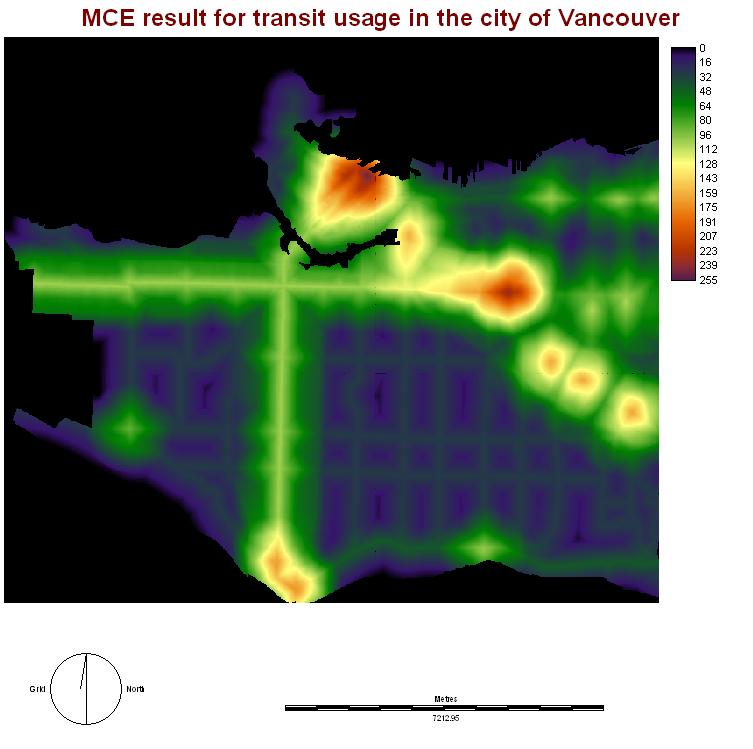 Fig 2. Result 1 --Transit usage based on distance to transit. Highest score is shown in red and Lowest score is shown in dark blue. 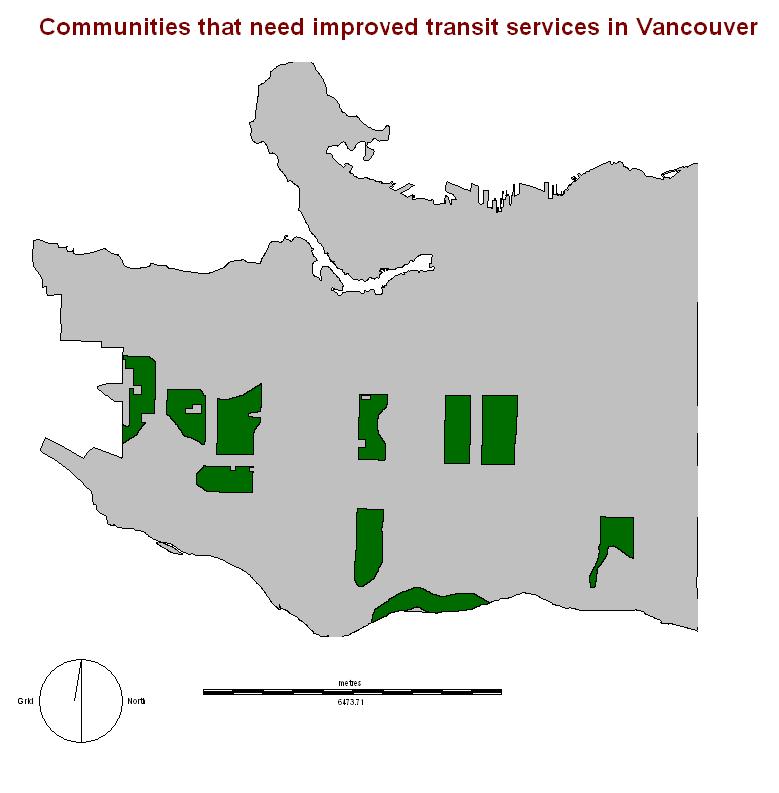 Fig 3. Result 2 -- Green areas are communities that need improved transit services. 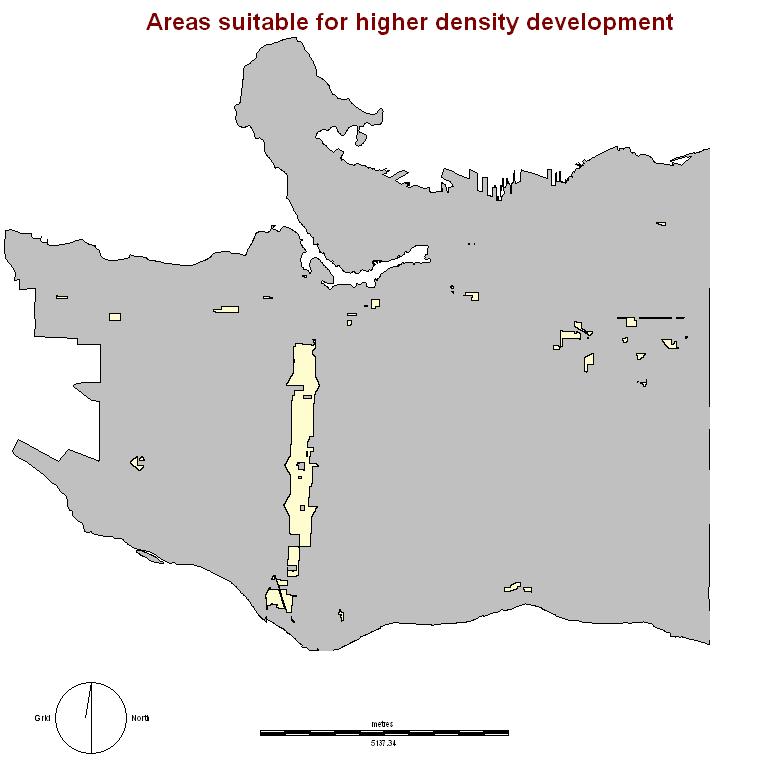 Fig 4. Result 3 -- The light yellow areas are communities that can support higher density growth. |