
|
||||
| Project
Home
Introduction
Data
acquisition Methodology
Spatial
Analysis
Errors/Problems |
| Errors/Problems |
Back
to Project Home |
| Methodological
Errors
Since the
analysis of this project involve using
census data, it is always preferable to use the most update version of
census
data available. The most recent version
of the census data is the DA (Dissemination area) census 2001 data
downloaded
from the With
the exception of skytrain stations, B-line bus, peak hour bus
and bus exchange, all the other bus routes are assigned the same value
in the
MCE analysis. This cannot fully
reflect
the real life situation because different bus routes have different
frequency
services. A higher frequency
routes are
obviously more attractive than a low frequency routes.
Thus
it is useful if we can gather data based
on the bus routes frequencies. Time
lag of the data – because Translink is constantly changing
its service area, the bus route data may not be a hundred percent
correct. Operational
Errors One of the
operational problems encountered in this
project is that when I want eliminate parks area when doing the
analysis, the
outlines of some of the parks still show up (
Fig 1.). Although
these outlines did not quite affect the result of
the analysis,
they are potential sources of errors if I want to perform more analysis. The
possible reason is that the landuse
polygon I imported from ArcGIS did not match the municipal ( |
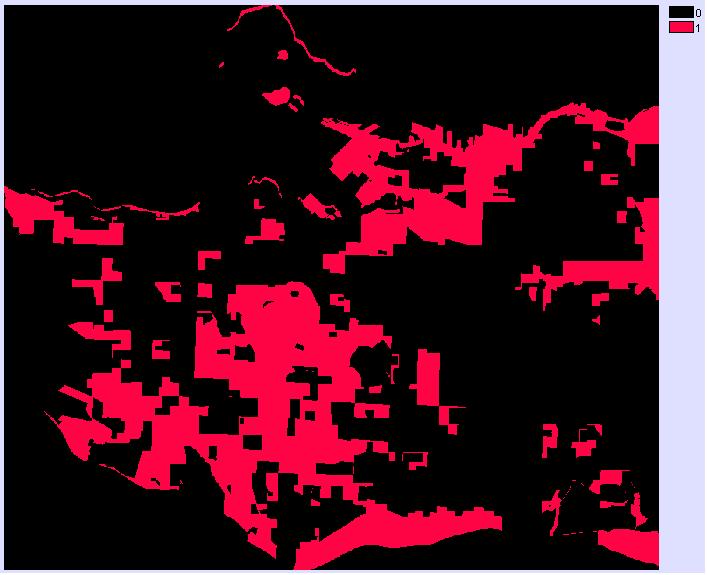 Fig 1. Notice that the outlines and the Lost Lagoon of the Stanley Park show up although I tried to eliminate all the park areas. This is an example of different quality of data. |