| |
The Vancouver Island Health Authority (VIHA) employs over 18,000 individuals to monitor and provide healthcare to British Columbian communities located on Vancouver Island, some parts of the Sunshine Coast and Central Coast, and the Georgia Strait’s archipelagos (Figure 1) (Vancouver Island Health Authority 2012). Personnel from the VIHA Home Support department need to travel to their clients’ residence to provide home support care, however this department wants to improve travel time and productivity by determining where an employee should work and by creating an efficient travel and work schedule. The development and implementation of both social and medical programs that assist outpatients so they remain in their residence as they recover or receive palliative care is referred to as home healthcare (Woodward et al. 2004).
In Canada, as well as in other industrial countries, the demand for home healthcare (HHC) service has been proliferating, and the current system is not prepared to mange this increase in the long term (Coyte 2000). As such, innovative and practical solutions are needed to maintain and improve HHC services. Several factors have contributed to this strain and augmentation. Mainly, health authorities are not receiving enough financial support by the Canadian government to counterbalance the operating costs required to provide these services to the increasing number of people who rely on them (Coyte 2000). Additionally, as the Canadian population continues to mature the number of aged people will supersede the younger population, and this ballooning segment of the population will encumber health authorities from effectively administering medical and palliative care (Crooks et al. 2011).
Funding and demand are inequitable, nonetheless, the Canadian government began shifting administrative focus to HHC services to decrease expenditures. Outside of the government's primary objective, the “growth [of HHC services] is attributable to expanded beneficiary eligibility, increased accessibility, technological change, health system restructuring, and the aging and longevity of the population” (Coyte 2000, i) . Furthermore, HHC services have increased in popularity due to the growing number of Canadians who i) have physical disabilities or chronic illnesses that require home assistance and, ii) require additional medical assistance while they recover from acute illnesses or surgery at their residence (Woodward et al. 2004). Considering geographic information systems/science (GIS) has the potential to enhance how health authorities coordinate their services and improve patients’ accessibility to such services (Cinnomon, Shuurman, and Crooks 2008), various health authorities around the world have begun utilizing GIS to create optimal routes and working schedules (Begur, Miller, and Weaver 1997; Trautsamwieser and Hirsch 2011).
The use of GIS in a healthcare context has largely focused on epidemiological and preventable injuries analyses, homeland security and emergency planning, location-allocation of healthcare services and structures, healthcare accessibility based on geological and societal conditions, and implementing spatial decision support systems (DSS) (McLafferty 2003; Cinnamon, Schuurman, and Hameed 2011; Cromley 2003). Although some health agencies have developed GISystems to assist their organizations in producing optimal schedules and routing plans (Begur, Miller, and Weaver 1997; Trautsamwieser and Hirsch 2011), these programs appear to be rare and require companies to develop ad hoc codes and spatial technologies. Moreover, many non-healthcare agencies have tackled similar optimization strategies using GIS (Smaltschinski, Seeling, and Becker 2012; Weigel and Cao 1999). This project follows that trend.
TOP
Problem Definition
The VIHA Home Support department’s primary focus is to provide “personal assistance with bathing, dressing, mobilization, medication and oxygen therapy” (VIHA 2009, 6). Numerous hours are allocated to providing home support services, and VIHA wants to ensure their nurses can maximize their time helping as many patients as possible in a day and optimize their visits. Currently, VIHA’s scheduling is completed in Nanaimo without the aid of GIS. To comply with the home support department’s desire to improve and optimize their HHC services, VIHA is looking to employ an automated GIS model that can cluster the 3,000 home support patients they serve by their geographic location. The resulting clusters of patients should contain approximately 30 patients all of which are within a 10 minute drive of each other. The model produced must be able to cluster patients into these groups, calculate drive time between clusters, and calculate drive time between a home health care worker and a cluster.
To address VIHA’s request, our research team has developed a GIS model that can geocode the addresses of home support patients and then analyze the data in order to generate optimal work schedules. Our model incorporates various methods, such as performing cluster analyses on a spatial network, and utilizing Microsoft Excel, ArcGIS, SANET, and R software tools to compute and analyze the geodata and to produce the necessary outputs, which include the cartographic representations of client clusters, the provision of drive times between certain locations, and the creation of spreadsheets stating which clients belong to which cluster and local health areas (LHAs). Furthermore, this model allows client geodata to be updated as needed (VIHA will update it every three months). The scheduling of appointments and subsequent routing of home support workers within a cluster is not required as VIHA is looking to offer its workers a high degree of schedule flexibility and autonomy.
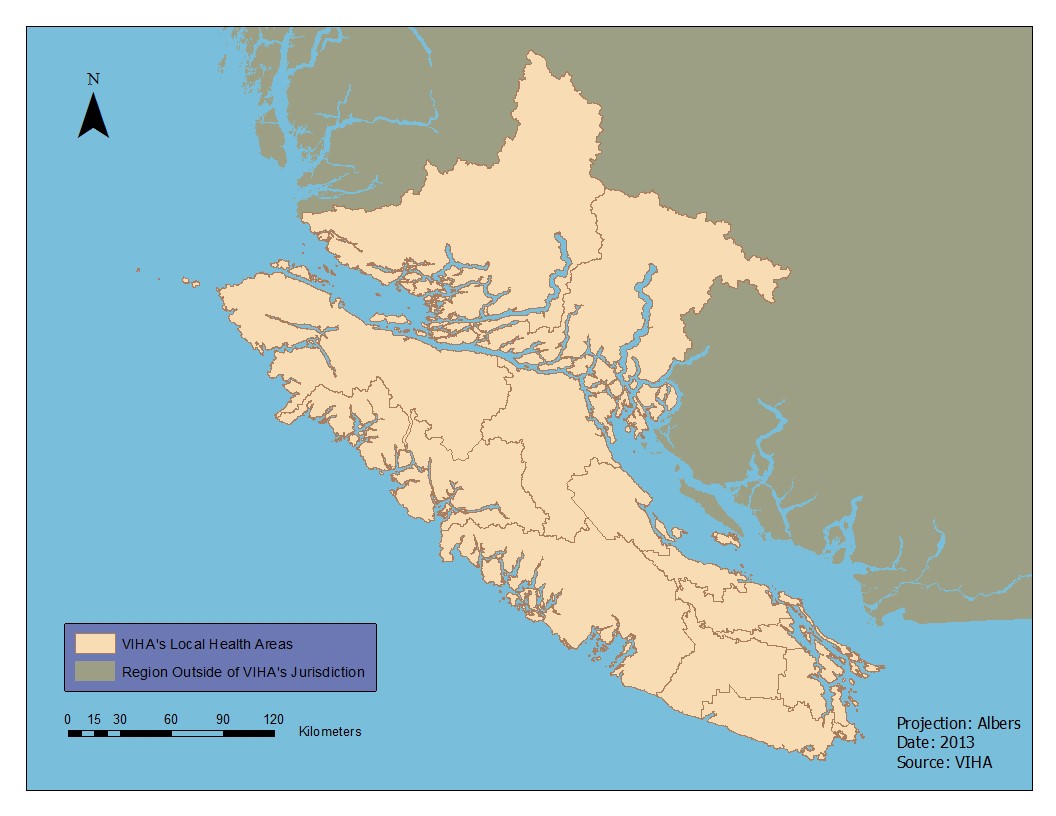
Figure 1. The geographic extent of Vancouver Island Health Authority with its 14 administrative sub-regions, known as Local Health Areas. (Click Image to Zoom)
TOP
Healthcare and GIS
Over the past sixteen years, more healthcare industries and GIS experts have been focusing on creating programs and/or models to optimize working schedules to resolve the aforementioned demands and pressures. The genesis has been attributed to Begur, Miller, and Weaver (1997), who produced a multi-complex system (GISystems and heuristic decision support systems) that used point pattern analysis (nearest neighbor) and qualitative and quantitative criteria to generate the optimal travelling routes an employee should take to efficiently arrive at their various destinations, and it calculated the approximate travel time. Subsequently, Cheng and Rich (1998) used a VRP (vehicle routing problem) and a VRPTW (vehicle routing problem with time windows) and a mixed integer linear programming formulation with double and triple indexed variables to produce optimal routes in order to curtail nurses from working overtime. Multiple routing and scheduling constraints were integrated. In the late 2000s researchers began concentrating to a greater extent on optimization systems for HHC organizations.
Bertels and Fahle’s (2006) objective was to create a model that created job-related schedules and their respective driving routes to bring down costs and, increase patient satisfaction and worker productivity. Their prototype implemented the PAR PAP software, which is an optimization kernel that utilizes a combination of linear programming, a constraint programming, and meta-heuristics. They incorporated both hard (travel time and distance) and soft/fuzzy (specialized nurses assigned to appropriate patients) constraints. Later that year Eveborn, Flisberg, and Rönnqvist (2006) published an article describing an optimization DSS they engineered. This DSS, called LAPS CARE, allows the user to produce individualized schedules derived from the employee’s skill, the patient’s need, and the travel time. Furthermore, this program delineates nurses on vector model maps, and LAPS CARE uses these maps to calculate travel time between destinations based on the shortest path network problem. In addition, Eveborn, Flisberg, and Rönnqvist (2006) cite a case study that implemented their DSS, and the results suggest their program reduced working time by 7% and travel time by 20%.
Bräysy, Dullaert, and Nakari (2007) also examined time saving. They employed a variation of a VRP to examine its effectiveness in decreasing the number of work shifts allotted to nurses who deliver meals, chauffeur the elderly, and work in HHC. Their analysis indicates the use of VRP programs could decrease work shifts by 36.8% to 71.1%. Dohn et al (2008) modified a VRPTW and coupled it with a branch and price approach, which in optimization method in applied mathematics, to produce working schedules that maximized productivity and minimized costs. Their final results suggest a VRPTW program is more effective at producing optimal schedules than manual productions.
Nickel, Schröder, and Steeg (2009) follows a similar, but more advanced, process as Bertels and Fahle (2006). To develop schedules that reduced overtime and drive times, Nickel, Schröder, and Steeg (2009) implemented an integrative solution that included diverse meta-heuristics and constraint programming, however, their current approach does not incorporate GIS and DSS. More recently, Trautsamwieser and Hirsch (2011) proposed a solution that can decrease overall travel time for HHC workers by 45%. Like previous work done in HHC optimization developments, Trautsamwieser and Hirsch (2011) used a meta-heuristic method, but theirs is associated with an algorithm called Variable Neighborhood Search. Their constraints include work qualifications, breaks, patient needs, and language skills. Moreover, travel time was determined based on Euclidean distance. Albeit this latest development is quite robust, this model cannot be used to generate optimal schedules and driving routes if the parameters exceed four nurses and twenty patients. The accomplishments in HHC optimization programs and models have been utilized globally and they are effective at solving their respective problems, yet they have their limitations in addition to their benefits.
The literature review reveals researchers working on optimizing HHC services execute (meta-heuristic) algorithmic and VRP programs, with a preponderance on point pattern analysis and Euclidean distance. Moreover, various hard and soft criteria are integrated into their processing, such as inputting break times, distance, overtime restrictions, work hours, language skills, patient needs, and client skills (this is not an exhaustive list). Lastly, the researchers’ problems are oriented around reduction (cutting costs, work shifts, and travel time) and productivity (organizing a best fit between client and employee, and optimizing the employee’s work day). However, none of these solutions address topography and rurality, which are two important factors that need to be considered in any decision making process in British Colombia (Castleden et al.2010).
McGregor et al. (2005) evaluated the effectiveness of BC’s emergency care system in Northern BC, which is a heavily rural region. They used Euclidean distance and road network methods to address their problem, and they compared and contrasted these two methods in order to determine the optimum technique. The geoanalysis conducted by these GIScientists used 50 km buffers, and the comparative analysis concluded Euclidean methods incorrectly classified around 18,000 individuals because this straight-line method is incapable of taking road conditions into consideration. Thus, using a road network in spacial or cluster analysis is more appropriate in certain contexts (McGregor et al. 2005; Fotheringham and Rogerson 2009).
TOP
Cluster Analysis of Points on a Spatial Network
Following the findings of McGregor et al. (2005) and Fotheringham and Rogerson (2009) our project employed a cluster analysis of points along a spatial network. Cluster analysis is an approach within spatial statistics concerned with the partitioning of spatial data into homogeneous classes, often represented as clusters. Its aim is to maximize the difference between classes while maximizing the similarity within classes. In doing so it reveals associations and structures within spatial data that provide greater understanding of spatial phenomena (Tan, Steinbach, and Kumar 2006). Cluster analysis has seen growth in recent decades as its application has enriched research in the fields of public health, epidemiology, geography, and criminology among others (Shiode and Shiode 2009). The most common form of cluster analysis is hierarchical cluster analysis which determines clusters through an iterative process. Hierarchical methods are divided into agglomerative and divisive, with agglomerative methods starting with every point as its own cluster and successively merging points together until all data points are within a single cluster. Divisive cluster analysis works in reverse, starting with a single cluster successively segregating points (Tan, Steinbach, and Kumar 2006). Within cluster analysis research two general streams have arisen: 1) the detection and measure of cluster existence, and 2) the identification of the location of clusters. Of late, focus has shifted to the latter of these streams, in particular focusing on the application of clustering techniques to spatial networks (Lu 2005).
When looking at research into the identification of cluster location, a large body of literature exists concerning the application of clustering methods to points found in planar, or 2-dimensional, space. In these methods Euclidean distance is used to measure point proximity and partition spatial data into clusters (Okabe and Satoh 2009). However, as highlighted by McGregor et al. (2005) and Fotheringham and Rogerson (2009), there is a growing recognition that the spatial phenomena being examined are strongly influenced by the networked space in which they exist (see also Okabe, Yomono, and Kitamura 1995; Okabe and Yamada 2001; Lu 2005; Okabe and Satoh 2009). Recent studies have highlighted the tendency of Euclidean cluster analysis to produce cluster results which do not relate to the underlying physical relationships of the phenomena being examined (Lu 2005). The long time use of Euclidean cluster analysis can be attributed to a lack of digital data, the poor quality of geographic software, and underdeveloped computational methods needed to processes the spatial data (Okabe, Yomono, and Kitamura 1995). Recently, however, the rapid development of GIS software programs and the computational methods needed for processing have allowed researchers to move beyond Euclidean cluster analysis and analyse spatial data using network cluster analysis (Okabe and Yamada 2001).
Network cluster analysis addresses the limitations of Euclidean cluster analysis, better capturing the distances found in spatial processes. Network cluster analysis is concerned with phenomena that occur on or near a spatial network, such as road or rail networks (Okabe and Satoh 2009). Four distinct features distinguish network cluster analysis from Euclidean cluster analysis: 1) points contain location variables as well as attribute variables, 2) distance is measured as the shortest path between points on a network, 3) understanding of the topology of a network is required, and 4) merging of clusters may result in clusters that are disconnected internally (Sugihara, Okabe, and Satoh 2011).
As the field of GIS has evolved there has been a concurrent push to expand the capabilities of software for use with network cluster analysis. This has resulted in the creation of a number of software programs which work with the mainstream software suites such as ESRI’s ArcGIS (See ComplexNetGIS, Caschili 2010; GeoDaNet, Hwang and Winslow 2012; SANET, Okabe, Okunuki, and Shiode 2006). Of these, the Spatial Analysis along Networks (SANET) program is the most comprehensive, providing a robust set of computational tools for researchers. With the development of the point cluster method within SANET, researchers are now able to cluster points residing on a network without relying on imperfect Euclidean cluster analysis (Sugihara, Okabe, and Satoh 2011).
TOP
|
|