| |
The model was used to carry-out a spatial network cluster analysis of patient addresses which then reintroduced the discovered cluster membership into the original patient address data. This provides for the use of the proximity of patients, as measured along a road network, to schedule home support worker visits, as well as providing for the visualization of this data in ArcMap and Excel (Figure 3).
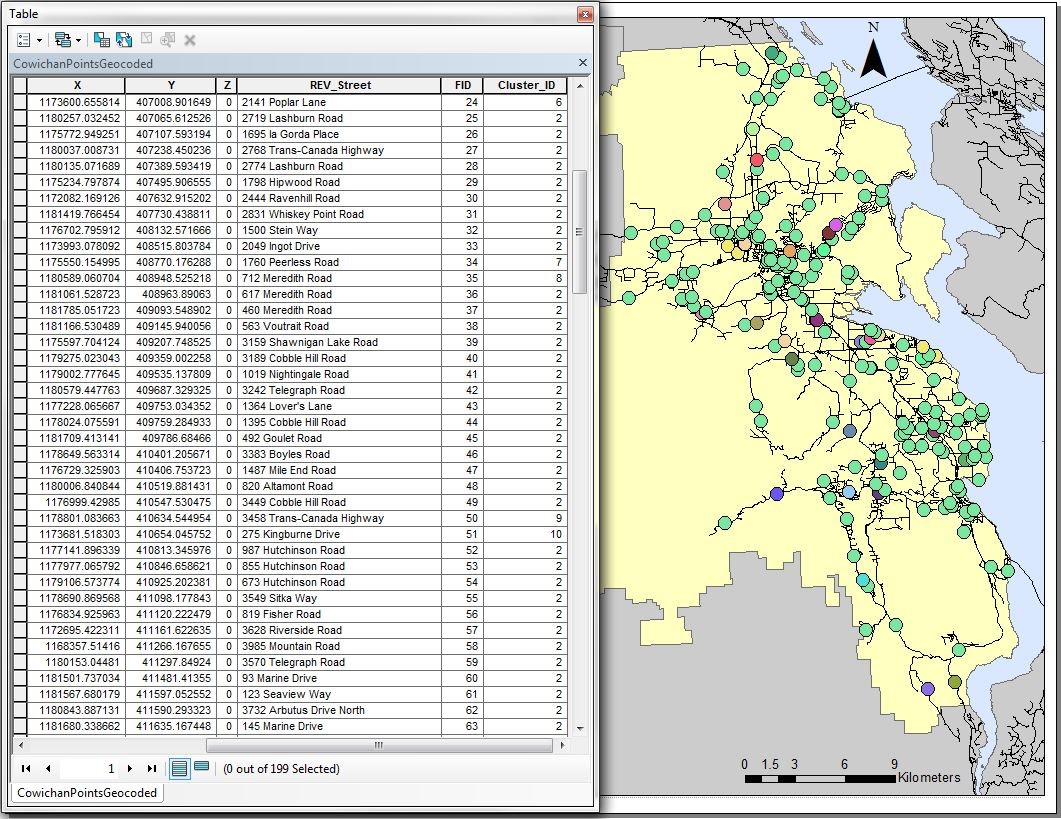
Figure 3. Patient addresses with cluster membership field (left) visualized in ArcMap (right). (Click Image to Zoom)
However, this process was not automated as originally desired by VIHA. The processes carried out to achieve the final product were done manually at each stage of the model.
In addition to providing for the visualization of patient address cluster membership the model proved the validity of its theoretical foundation, successfully bypassing the limitations of Euclidean based proximity analysis, creating patient clusters that more accurately capture networked real-world processes. This is highlighted within the circles and rectangles in the Lake Cowichan LHA (Figure 4); the k-means clustering analysis undertaken in S PLUS, which uses Cartesian space and Euclidean distance measures, incorrectly clusters together patient addresses which are a great driving distance from each other. Conversely, the spatial network clustering analysis used in SANET correctly identifies these patient addresses as being a great distance apart and assigns them to different clusters. Additionally, the spatial network clustering method correctly identifies when patient addresses distant in Euclidean space should be clustered together in networked space, as can be seen in the rectangles. Once again, the Euclidean based clustering analysis fails to recognize this relationship and instead assigns these patient addresses to two different clusters.
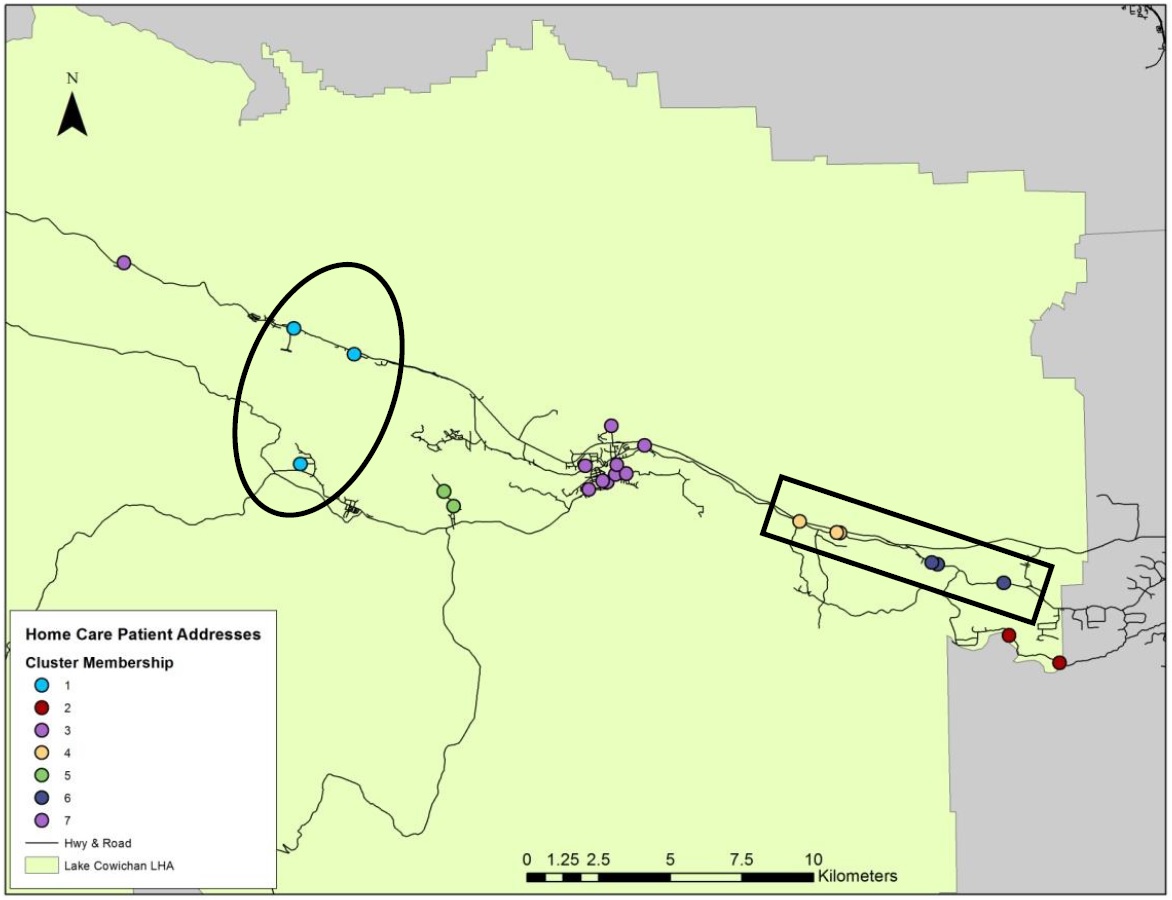
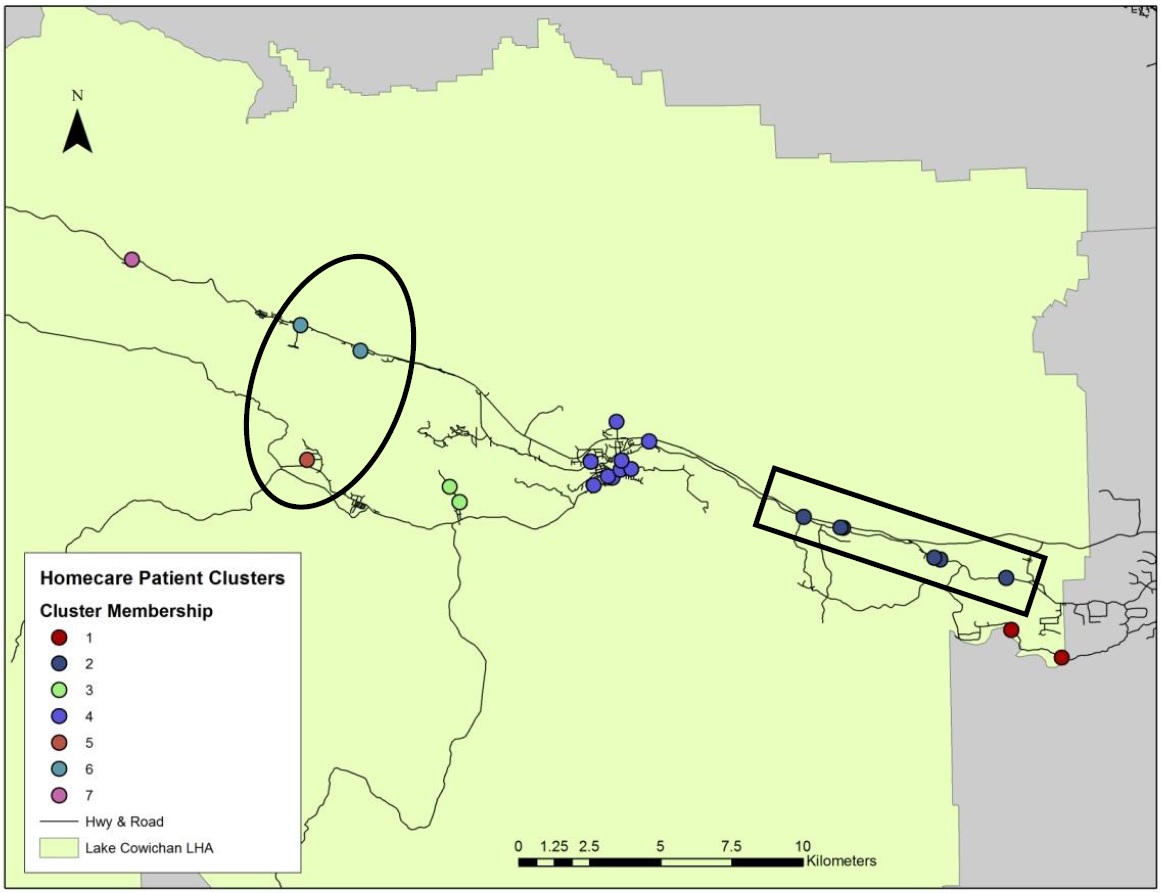
Figure 4. Cluster analysis using Euclidean distance (top) in comparison to cluster analysis along a spatial network (bottom) in the Lake Cowichan LHA. Circles and rectangles highlight the success of spatial network cluster analysis. (Click Images to Zoom)
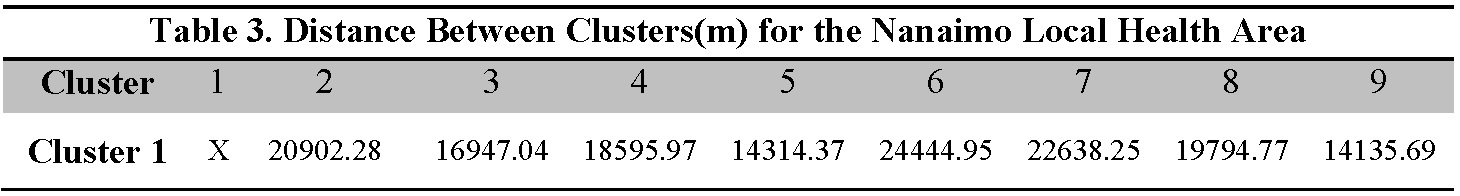
In addition to the success of the model, we were also able to calculate the distance between addresses within a cluster and the distances between clusters along a weighted network. Within cluster distance (Table 2) and cluster to cluster distances (Table 3) for the Nanaimo LHA are provided. In both cases, by measuring the distance from every patient address to every other patient address and taking the average we provide a measure reflects the flexibility afforded VIHA home support workers in organizing their day.
The success of our model was balanced by some persistent challenges. Our study suffered from lack of real patient data and a subsequent reliance on randomly generated patient addresses. In using randomly generated patient addresses we eliminate any natural clustering and thus the ability of the point clustering tool to detect and distinguish naturally occurring clusters within patient address data. This is best illustrated in the dendrogram for the Alberni LHA (Figure 5). The y-axis indicates the distance between clusters at which clusters merge (Okabe and Sugihara 2012).
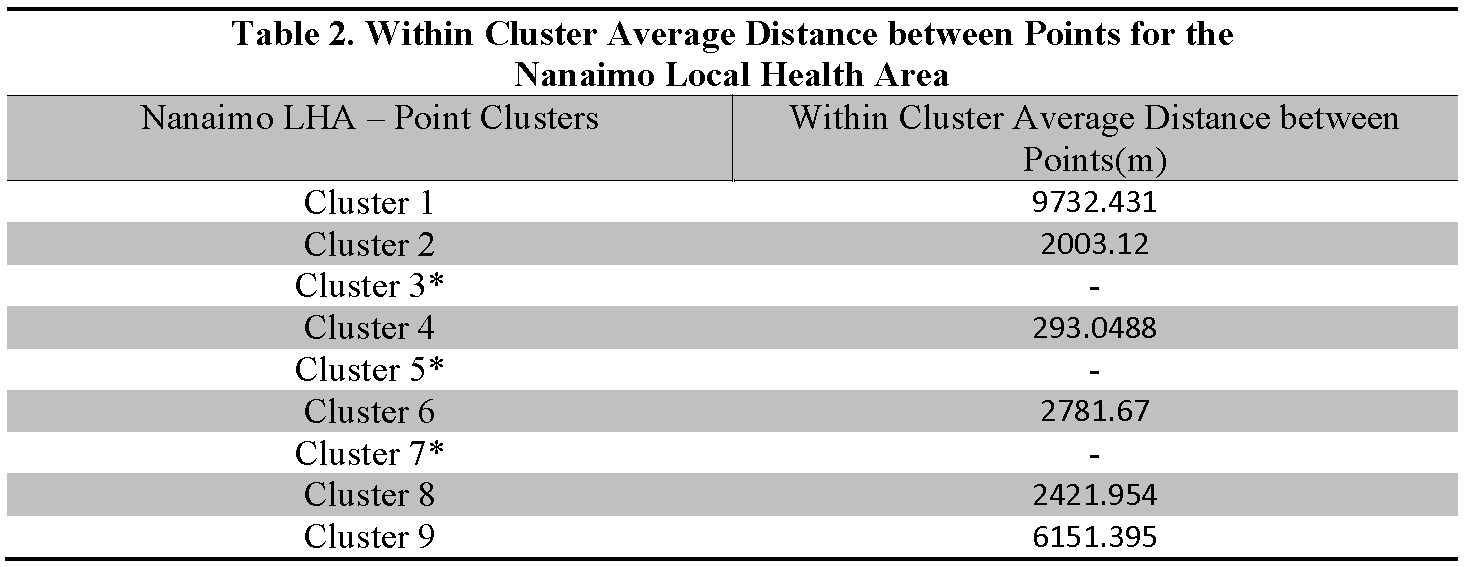 *Those clusters with no average contained only a single point. (Click Image to Zoom)
 (Click Image to Zoom)
The sharp decrease in overall clusters at a relatively short distance indicates the random distribution of points along the network and explains the inability of the SANET tool to clearly distinguish clusters of patient addresses. The distinction between random and non-random points is difficult to recognize using visual analysis alone (Figure 6). That some LHAs showed a slight tendency towards clustering can be attributed to the removal of patient addresses during the geocoding process, the reasons for this noted in the Utilized Data section.
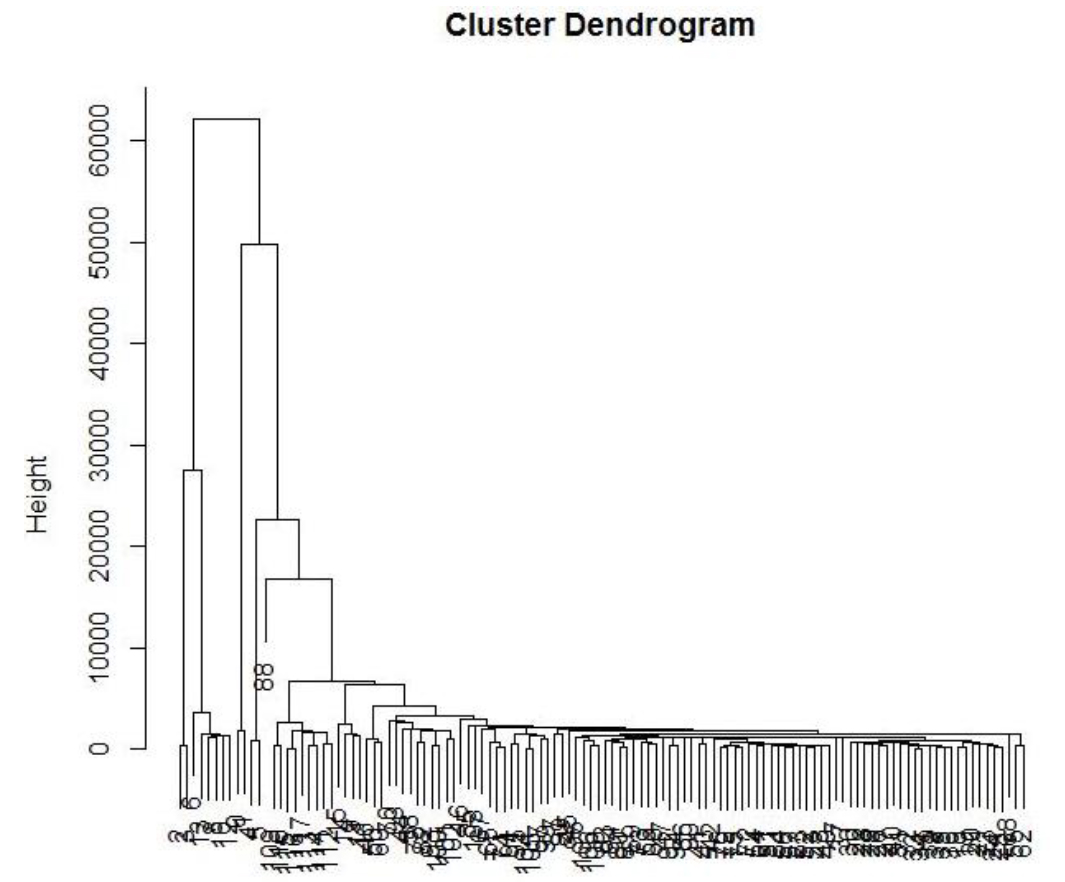
Figure 5. Cluster Dendrogram of patient addresses in the Alberni LHA illustrating random distribution of patient addresses along the road network. (Click Image to Zoom)
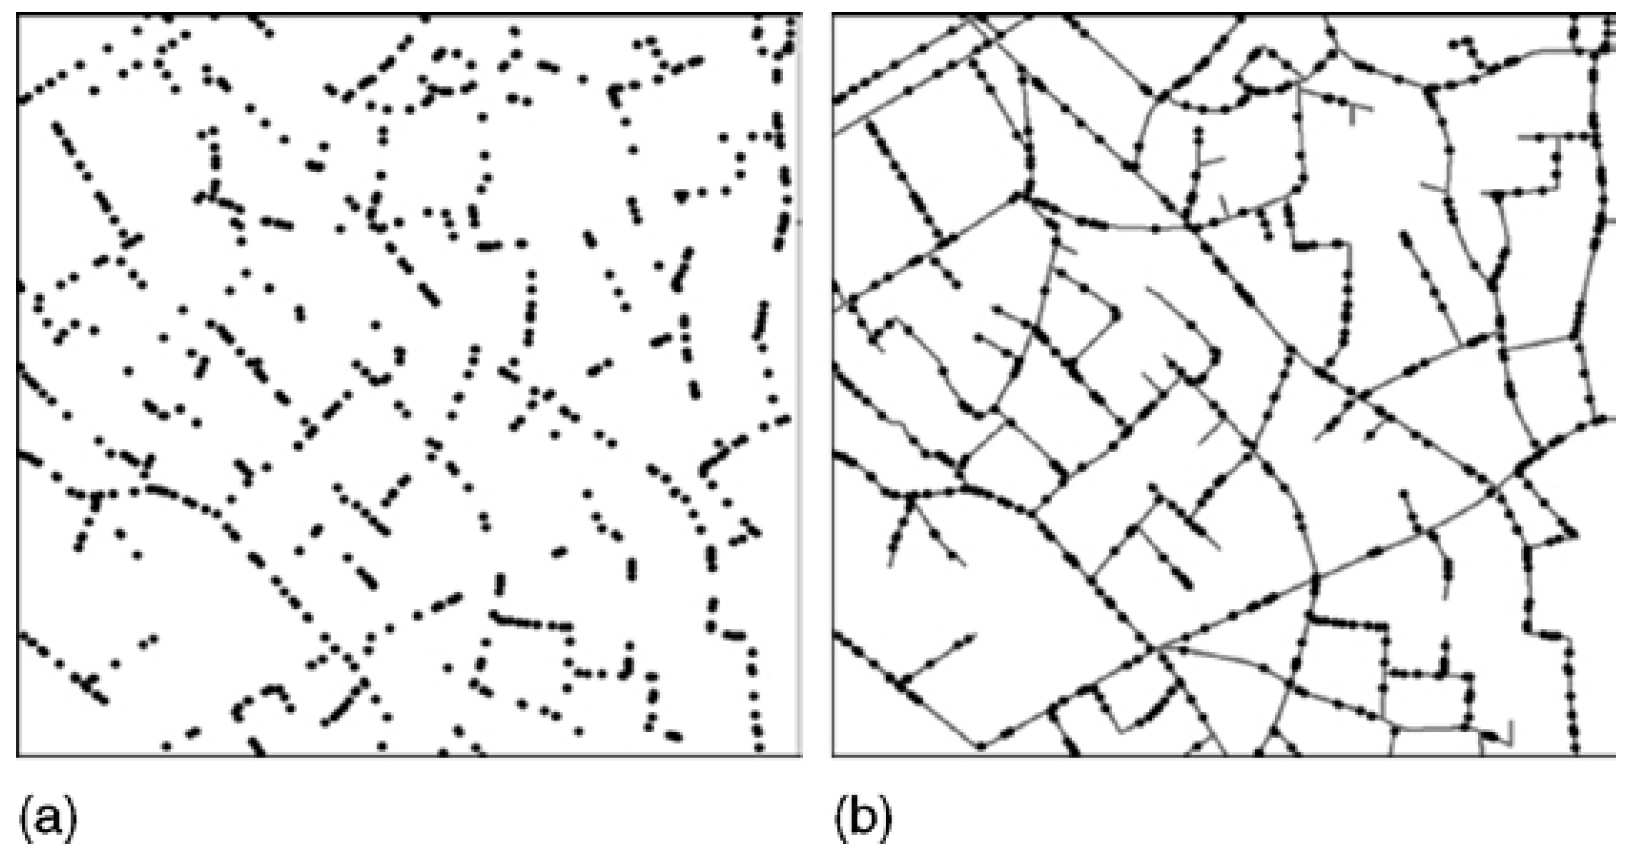
Figure 6. Non-randomly distributed points on a plane(a) and randomly distributed points on a network(b). (Okabe and Satoh 2009) (Click Image to Zoom)
TOP
|
|