The Canadian health system is increasingly under stress from an aging population and reduction of healthcare funding. Nowhere is this stress greater felt than in the home support field. Home support can be thought of as the development and implementation of both social and medical programs that assist outpatients so they remain in their homes. In order to optimize home support scheduling and mitigate the strain of increased demand, health authorities have increasingly turned to GIS. Predominant within the scheduling literature are route finding approaches which are based on a linear progression between locations. However, this approach is not ideal in situations where health authorities wish to provide their employees with high levels of autonomy and flexibility. Accordingly, in this paper we outline a new method of home support scheduling based on spatial network cluster analysis in partnership with an integrated software model to group patients by address along a road network. We then apply this model to the area administered by the Vancouver Island Health Authority (VIHA). We find that this approach successfully groups patients by address while avoiding the limitations of Euclidean based cluster methods. The advantages and limitations of this approach are then reviewed and directions for further research are discussed.
Proposal Introduction As the Canadian population continues to mature the number of aged people will supersede the younger population, and this ballooning segment of the population will encumber health authorities from effectively administering medical and palliative care (Crooks et al. 2011). To improve present and future healthcare for home care patients our research team will develop a GIS model that will geocode the addresses of home care patients for the Vancouver Island Health Authority (VIHA) and then analyze the data in order to generate optimal patient schedules. Our methodology will focus on cluster analyses on a spatial network, and we will be implementing Microsoft Excel, ArcGIS, SANET, and R software tools to compute and analyze the geodata and to produce the necessary outputs. Our model will be dynamic to allow client geodata to be updated as needed. The expected results include cartographic representations of client clusters, the ability to input schedule preferences based on the employee and patient requests, provide drive times between certain locations, and create a spreadsheet stating which clients belong to which cluster and local health areas (LHA). Although some health agencies have developed GISystems to assist their organizations in producing optimal schedules and routing plans (Begur et al. 1997; Trautsamwieser and Hirsch 2011), these programs appear to be rare and require companies to develop ad hoc codes and spatial technologies. Moreover, many non-healthcare agencies have tackled similar optimization strategies using GIS (Smaltschinski et al. 2012; Weigel and Cao 1999). This project follows that trend.
Proposal Literature Review Cluster Analysis of Points on a Spatial Network
Cluster analysis is an approach within spatial statistics concerned with the partitioning of spatial data into homogeneous classes, often represented as clusters (Tan et al 2006). Its aim is to maximise the difference between classes while maximizing the similarity within classes (Tan et al 2006). In doing so it reveals associations and structures within spatial data that provide greater understanding of spatial phenomena (Tan et al 2006). Cluster analysis has seen growth in recent decades as its application has enriched research in the fields of public health, epidemiology, geography, and criminology among others (Shiode and Shiode 2009). The most common form of cluster analysis is hierarchical cluster analysis which determines clusters through an iterative process(Tan et al 2006). Hierarchical methods are divided into agglomerative and divisive, with agglomerative methods starting with every point as its own cluster and successively merging points together until all data points are within a single cluster(Tan et al 2006). Divisive cluster analysis works in reverse, starting with a single cluster successively segregating points(Tan et al 2006). Within cluster analysis research two general streams have arisen: 1) the detection and measure of cluster existence, and 2) the identification of the location of clusters (Lu 2005). Of late, focus has shifted to the latter of these streams, in particular focusing on the application of clustering techniques to spatial networks (Lu 2005).
When looking at research into the identification of cluster location, a large body of literature exists concerning the application of clustering methods to points found in planar, or 2-dimensional, space (Okabe and Satoh 2009). In these methods Euclidean distance is used to measure point proximity and partition spatial data into clusters (Okabe and Satoh 2009). However, there is a growing recognition that the spatial phenomena being examined are strongly influenced by the networked space in which they exist (Okabe et al 1995; Okabe and Yamada 2001; Lu 2005; Okabe and Satoh 2009). Recent studies have highlighted the tendency of Euclidean cluster analysis to produce cluster results which do not relate to the underlying physical relationships of the phenomena being examined (Lu 2005). The long time use of Euclidean cluster analysis can be attributed to a lack of digital data, the poor quality of geographic software, and underdeveloped computational methods needed to processes the spatial data (Okabe et al 1995). Recently, however, the rapid development of GIS software programs and the computational methods needed for processing have allowed researchers to move beyond Euclidean cluster analysis and analyse spatial data using network cluster analysis (Okabe and Yamada 2001).
Network cluster analysis addresses the limitations of Euclidean cluster analysis, better capturing the distances found in spatial processes. Network cluster analysis is concerned with phenomena that occur on or near a spatial network, such as road or rail networks (Okabe and Satoh 2009). Four distinct features distinguish network cluster analysis from Euclidean cluster analysis: 1) points contain location variables as well as attribute variables, 2) distance is measured as the shortest path between points on a network, 3) understanding of the topology of a network is required, and 4) merging of clusters may result in clusters that are disconnected internally (Sugihara et al 2011).
As the field of GIS has evolved there has been a concurrent push to expand the capabilities of software for use with network cluster analysis. This has resulted in the creation of a number of software programs which work with the mainstream software suites such as ESRI’s ArcGIS (See ComplexNetGIS, Caschili 2010; GeoDaNet, Hwang and Winslow 2012; SANET, Okabe and Okunuki). Of these, the Spatial Analysis along Networks (SANET) program is the most comprehensive, providing a robust set of computational tools for researchers. With the development of the point cluster method within SANET, researchers are now able to identify the location of clusters on a network without relying on imperfect Euclidean cluster analysis (Sugihara et al 2011).
Proposal Methods Problem Definition
The Vancouver Island Health Authority is looking to create an automated software model that can group the 3,000 home health care patients they serve by their geographic location. The resulting clusters of patients should contain approximately 30 patients all of which are within a 10 minute drive of each other. The model produced must be able to cluster patients into these groups, calculate drive time between clusters, and calculate drive time between a home health care worker and a cluster.
To expand our project our model will offer the capability to integrate qualitative data based on an employee preference and the client needs, such as language preference or specialized treatment. As such, our model will be able to create network clusters based on this qualitative information in addition to the client’s addresses.
The scheduling of appointments and subsequent routing of home health care workers within a cluster is not required as VIHA is looking to offer its workers a high degree of schedule flexibility. Method
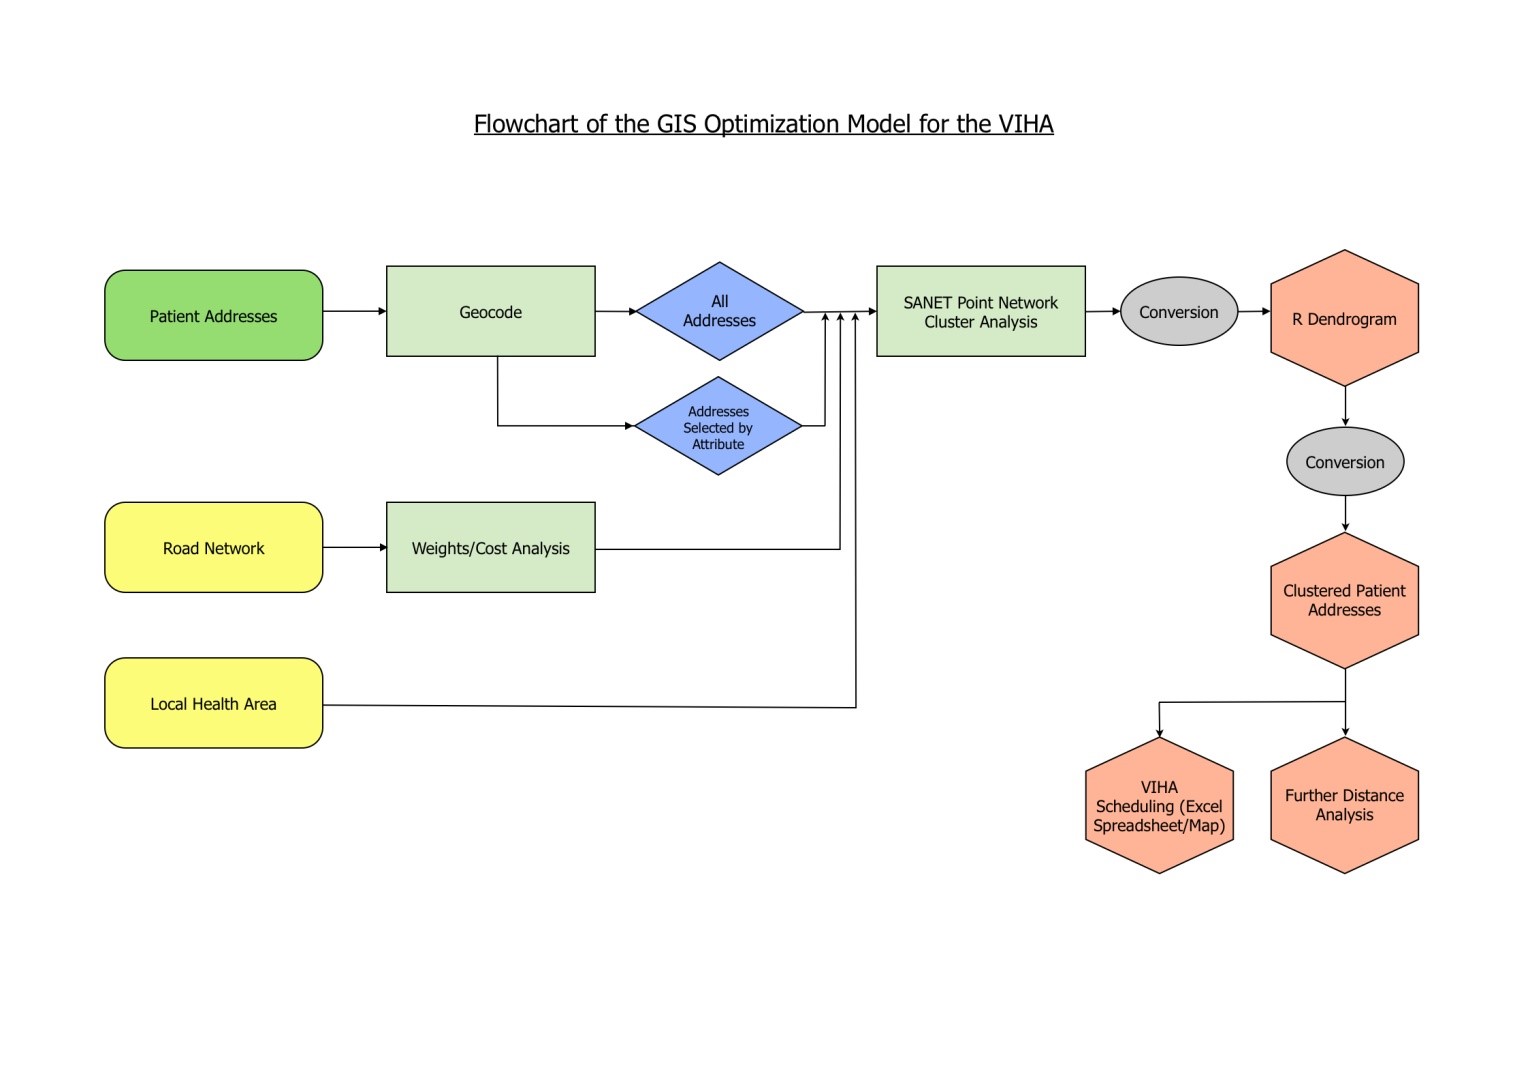
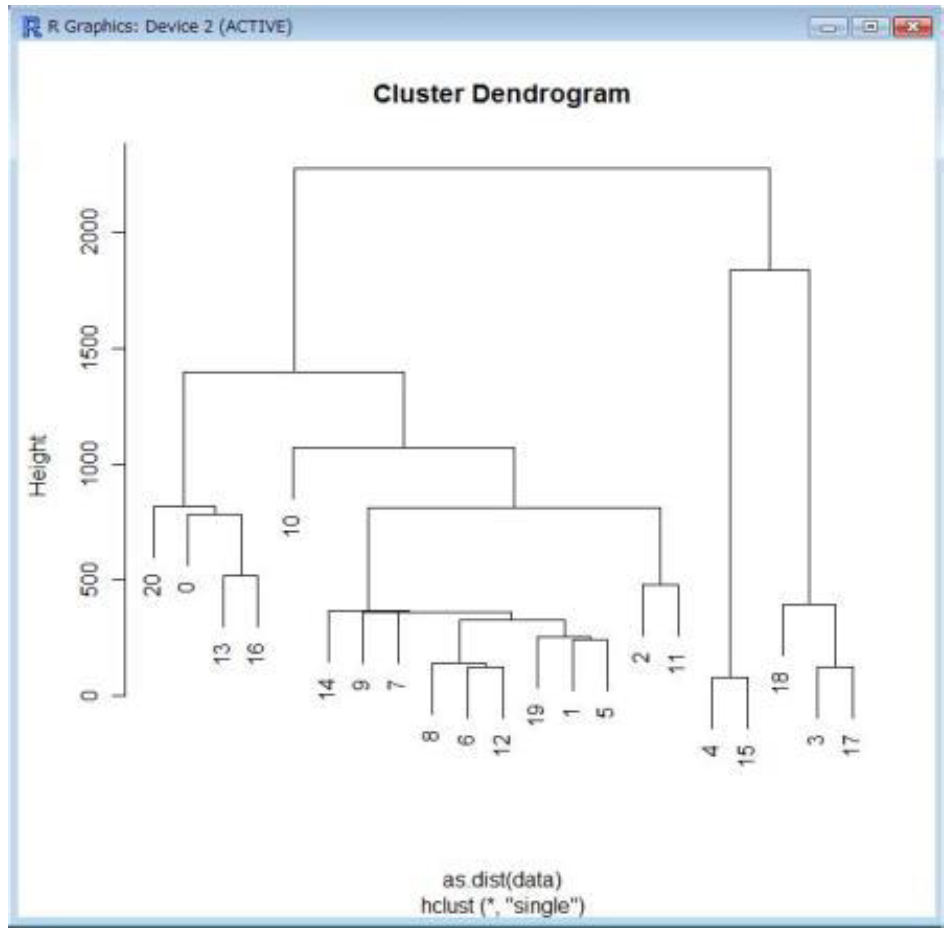
Our model will be based upon a network cluster analysis using an agglomerative hierarchical clustering method. Our first step will be to geocode the 3,000 randomly generated addresses contained within a Microsoft Excel spreadsheet through the geocode tool in ArcMAP 10(Fig. 1). Following this, we will use the SANET software program’s point clustering tool to carry-out a network cluster analysis on the geocoded addresses and generate a hierarchy of nested clusters (Sugihara et al 2011). The result of this process will be a dendrogram visualized through the R software program (Fig 2) (Sugihara et al 2011).
Fig. 1 Flowchart of the GIS Optimization Model for the VIHA. (Click Image to Zoom)
With the clusters identified, the cluster dendrogram in R will be exported to a Microsoft Excel format using the xlsReadWrite package found in R (Kabacoff 2012). Once in an Excel format, the clustered addresses can be joined to the original attribute table and visualized in ArcMap (Geocoding) or left as a spreadsheet in Excel for scheduling purposes. The hierarchical clustering technique does not allow us to explicitly set the number of clusters. Instead we will pick a cut-off that will yield an appropriate number of clusters (Tan et al 2006). This cut-off is determined by driving time and the number of points within each cluster. Once the address clusters have been identified we will find the mean centre for each cluster (Fig 3) (Finding Mean Centre). With this central point we can measure the network distance between clusters, and between clusters and home care worker origin (Finding Mean Centre).
Fig 2. Dendrogram produced by SANET and viewed in R.
Source: Spatial Analysis along Networks - Manual for SANET V4.1 (Click Image to Zoom)
Fig 3. Finding the Mean Centre from Clustered Addresses.
Source: ArcGIS Resource Centre (Click Image to Zoom)
Proposal Deliverables
At the conclusion of this project we will have produced an automated model utilizing Microsoft Excel, ArcGIS 10, SANET, and R statistical software that utilizes Excel spreadsheets as both its input and output. This model will be able to cluster patients geographically according to both the number of points and travel time criteria specified. Additionally, the model will be able select patients by a variety of attributes and determine cluster to cluster and cluster to home worker origin distances along a road network.
Table 1. List of data that will be used and their respective sources. (Click Image to Zoom)
Due to the privacy and confidentiality issues, client’s addresses will not be used for this study. Instead, addresses will be created randomly. In order to provide an effective and robust result we will create 3,000 random points to perform the cluster analysis. These points are constrained within the road networks to ensure the addresses are accessible (Table 1).
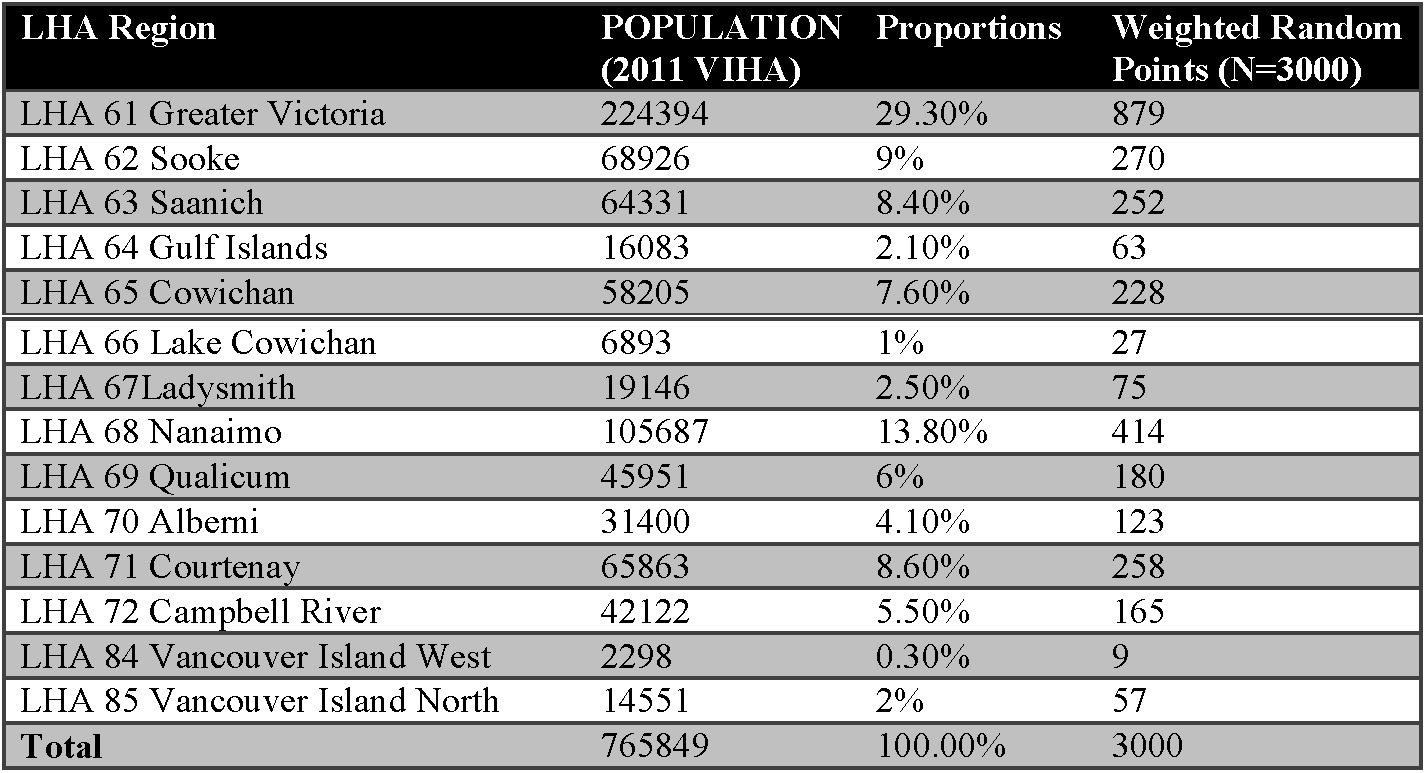
In order to improve the accuracy, the random points are generated based on population distribution. The proportion (in percentage) of each local health area is calculated to weight the number of points. The output points will also have a multipart or single part feature, and indicate that a single point can have more than one client (Table 2).
Table 2. Distribution of Generated Points as Determined by Current Population Distribution (Statistics Canada 2011 Census). (Click Image to Zoom)
Utilized Software
We will use the following software programs throughout our project: Microsoft Excel; ESRI ArcGIS 10; SANET ArcGIS 10 toolbox extension; R Statistical Software.
Proposal Limitations of Our Approach
We have identified four key limitations within our problem space. These limitations are directly related to the staticity of data, privacy concerns, process automation, and problem satisfaction: (1)Our data is static, thus it is unable to capture various changes in the underlying road network, whether they are hour by hour or over several months (this includes traffic accidents, road closures, and adverse environmental conditions). (2)Privacy concerns are a limiting factor to the data, reducing the ability to accurately capture real-world distribution. (3)The geocoding process cannot be fully automated, it returns errors that need to be deduced by a user and cannot be addressed by a computer. (4)The problem asks to define areas that contain (a) 30 patients that are within (b) 10 minutes driving time from each other. In some cases, both of these criteria cannot be satisfied and priority must be given to either drive time or the number of patients; ultimately priority is determined by the VIHA.
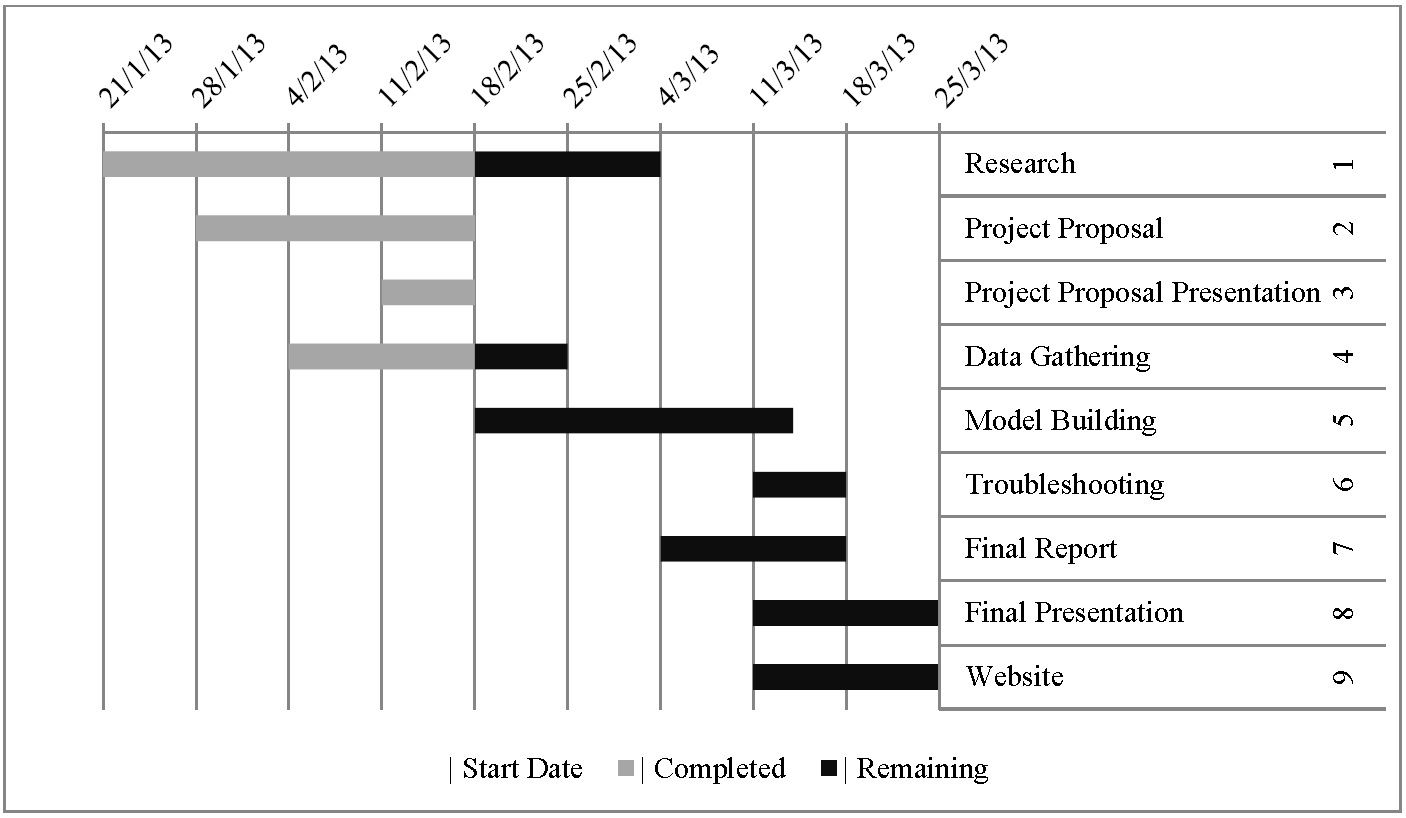
Table 3. Research timeline via a GANTT chart. (Click Image to Zoom)
The timeline for this project is detailed above in the GANTT chart (Table 3). There will be no specific division of labour though James Mack will act as our liaison with the Vancouver Island Health Authority.
Proposal Works Cited
Begur, Sachidanand, David M. Miller, and Jerrry R. Weaver. "An Integrated Spatial DSS for Scheduling and Routing Home-Health-Care
Nurses." Interfaces 27.4 (1997):35-48. Print.
Crooks, Valorie A., Nadine Schuurman, Jonathan Cinnamon, Heather Castleden, and Rory Johnston. "Refining a Location Analysis
Model Using a Mixed Methods Approach:Community Readiness as a Key Factor in Siting Rural Palliative Care Services." Journal of
Mixed Methods Research 5.77 (2011):77-95. Print.
“Finding Mean Centre”. ArcGIS Resource Centre. N.p. n.d. 14 Feb 2013
“Geocoding”. ArcGIS Resource Centre. N.p. n.d. 16 Feb 2013.
Kabacoff, Robert I. “Exporting Data”. Quick R. N.p., 2012. Web. http://www.statmethods.net/input/exportingdata.html.
Lu, Yongmei. “Approaches for Cluster Analysis of Activity Locations along Streets: from Euclidean Plane to Street Network Space”.
Texas: Texas State University – San Marcos, 2005. Cartography and Geographic Information Society. Web. 11 Feb. 2013.
Okabe, Atsuyuki, and Toshiaki Satoh. “Spatial Analysis on a Network.” The SAGE Handbook of Spatial Analysis. 2009. 1-34. SAGE
Research Methods. Web. 5 Feb. 2013
Okabe, Atsuyuki et al. “Statistical Analysis of the Distribution of Points on a Network.” Geographical Analysis 27:2 (1995): 152-175. Jon
Wiley Online. Web. 12 Feb. 2013
Okabe, Atsuyuki & Ikuho Yamada. “The K-Function Method on a Network and its Computational Implementation.” Geographical
Analysis 33:3 (2001): 271-290. Jon Wiley Online. Web. 11 Feb. 2013.
Shiode, Shino, and Narushige Shiode. “Detection of multi‐scale clusters in network space”. International Journal of Geographical
Academic Information Science 23:1 (2009): 75-92. Search Premier. Web. 11 Feb. 2013.
Sugihara, Kokichi et al. “Computational Method for the Point Cluster Analysis on Networks.” Geoinformatica 15 (2011):167–189.
Academic Springer Link. Web. 9 Feb. 2013.
Smaltschinski, Thomas, Ute Seeling and Gero Becker. "Clustering Forest Harvest Stands on Spatial Networks for Optimised
Harvest Scheduling." Annals of Forest Science 69 (2012):651-657. Print.
Tan, Pang-Ning, et al. Introduction to Data Mining. Boston: Pearson Addison Wesley, 2006. Web. 13 Feb. 2013.
Trautsamwieser, Andrea, and Patrick Hirsch. "Optimization of Daily Scheduling for Home Health Care Services." Journal of Applied
Operational Research 3.3 (2011):124-136. Print.
Vancouver Island Health Authority. "Welcome to VIHA." Vancouver Island Health Authority, 2012. Web. 14 February 2013 .
Weigel, Don, and Buyang Cao. "Applying GIS and OR Techniques to Solve Sears Technician-Dispatching and Home-
Delivery Problems." Interfaces 29.1 (1999):112-130. Print.