Effectiveness of GIS in assesing

 GRIZZLY BEAR HABITAT
In the Central Coast of Brittish Columbia.
GRIZZLY BEAR HABITAT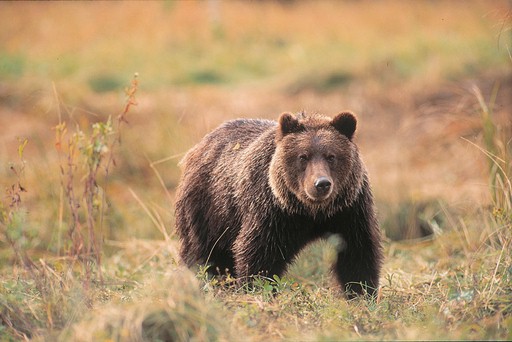 The results
of this model confirmed the prediction that the introduction of bias
into the decision making process would affect the overall outcome.
The first analysis that biased human influences produced area of high
quality habitat almost triple that of the neutral analysis. The
first MCE, when reclassed to highlight regions with habitat quality of 200
or more, had an area of 2,161,499 ha. The second analysis produced
an area of 639,791 ha of habitat above 200. The final analysis when
reclassed produced 890,765 ha of high quality habitat. Without further
exploration into qualifying the habitat rating scale in terms of what
constitutes high quality habitat, the selection of 200 was arbitrary. The
analysis that biased positive habitat criteria produced areas slightly
higher than the neutral analysis. These results are consistent
with the literature that suggest any grizzly bear habitat model should
include and appropriately weight both of these factors. Limitations
in this research design should not be understated. This model lacked
any information on specific bear location in the area or an attempt to
validate the model by comparing it to known populations. The omission
of data sets on important criteria and the absence of model validation
limit the usefulness of this model to predict habitat issues. The
analysis did illustrate that weighted pair wise comparisons used for the
final MCE the results were significant. A more thorough analysis would
be necessary to arrive at conclusions as to the effectiveness of GIS in
modeling grizzly bear habitat.
The results
of this model confirmed the prediction that the introduction of bias
into the decision making process would affect the overall outcome.
The first analysis that biased human influences produced area of high
quality habitat almost triple that of the neutral analysis. The
first MCE, when reclassed to highlight regions with habitat quality of 200
or more, had an area of 2,161,499 ha. The second analysis produced
an area of 639,791 ha of habitat above 200. The final analysis when
reclassed produced 890,765 ha of high quality habitat. Without further
exploration into qualifying the habitat rating scale in terms of what
constitutes high quality habitat, the selection of 200 was arbitrary. The
analysis that biased positive habitat criteria produced areas slightly
higher than the neutral analysis. These results are consistent
with the literature that suggest any grizzly bear habitat model should
include and appropriately weight both of these factors. Limitations
in this research design should not be understated. This model lacked
any information on specific bear location in the area or an attempt to
validate the model by comparing it to known populations. The omission
of data sets on important criteria and the absence of model validation
limit the usefulness of this model to predict habitat issues. The
analysis did illustrate that weighted pair wise comparisons used for the
final MCE the results were significant. A more thorough analysis would
be necessary to arrive at conclusions as to the effectiveness of GIS in
modeling grizzly bear habitat. 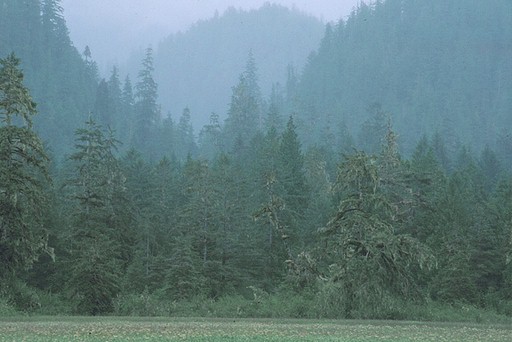 The integration of local knowledge, confirmed sightings and hunting
statistics are other important ways of acquiring information that can
be introduced into the dataset or used to test the model.
This realization is not new to issues of modeling grizzly bear habitat
and population densities, however the techniques for incorporating them
into models is still being improved. An obvious problem that can
arise from the integration of other forms of knowledge into the mapping
of resources is the high degree subjectivity inherent in this type of information.
An illustrating anecdote describes how a large forest company performed
wildlife surveys for the spotted owl in the height of the old growth vs.
spotted owl controversy of the early 90’s. This company's biologists
routinely identified fewer spotted owls than government biologists.
Had the forest been ‘re-mapped’ by each respective party, the resultant
data would have been quite different, consistent with the objectives of each
party.
The integration of local knowledge, confirmed sightings and hunting
statistics are other important ways of acquiring information that can
be introduced into the dataset or used to test the model.
This realization is not new to issues of modeling grizzly bear habitat
and population densities, however the techniques for incorporating them
into models is still being improved. An obvious problem that can
arise from the integration of other forms of knowledge into the mapping
of resources is the high degree subjectivity inherent in this type of information.
An illustrating anecdote describes how a large forest company performed
wildlife surveys for the spotted owl in the height of the old growth vs.
spotted owl controversy of the early 90’s. This company's biologists
routinely identified fewer spotted owls than government biologists.
Had the forest been ‘re-mapped’ by each respective party, the resultant
data would have been quite different, consistent with the objectives of each
party.