Effectiveness
of GIS in assesing
 GRIZZLY BEAR HABITAT
In the Central Coast of Brittish Columbia.
 The project design focused on three themes.
These were the creation of a grizzly bear habitat capability model,
the performing of multiple multi-criteria analyses (MCE) and comparing
the results of the MCE.
The project design focused on three themes.
These were the creation of a grizzly bear habitat capability model,
the performing of multiple multi-criteria analyses (MCE) and comparing
the results of the MCE.
To illustrate the ways in which institutional
objectives might influence the decision set, three differently weighted
multi criteria analysis were performed. The MCE technique, offered
in the Decision Support module of Idrisi, enables several different spatial
data criteria to be analyzed. Habitat quality is best described in
terms of a range of suitability, not in terms of crisp boundaries.
For example, old forest is more desirable than selectively logged forest,
which is in turn more desirable than logged forest. For this reason,
all factors were described using weighted linear combination (WLC) where
factors were standardized to a common numeric range from 0-255 using fuzzy
logic (Ronald, 1999).
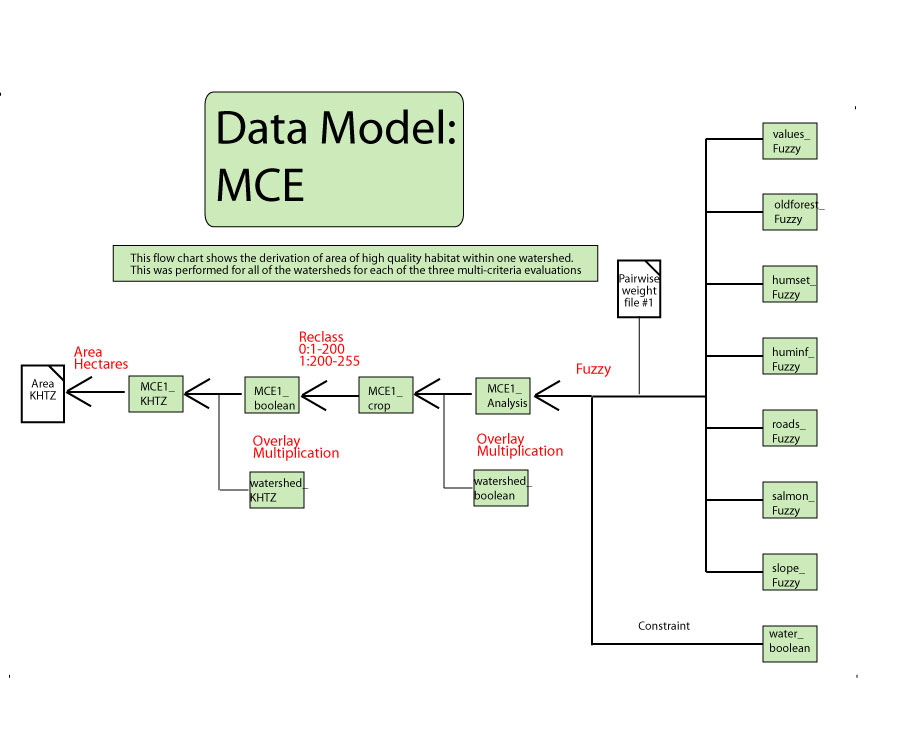
With a MCE evaluation in Idrisi, regions
that rank high in one factor can balance low performance in another.
Additionally, the degree to which certain factors are allowed to influence
the final decision can be manipulated. This process of weighting criteria
differently was used in an attempt to mimic how different approaches to
performing a multi-criteria evaluation can use similar data sets to arrive
at different decisions. The computer analyzed each cell by multiplying
the value of a factor by its weighted importance and then summed the total
from all of the factors to arrive at a new value that accounts for that cell's
total performance. The final analysis of constraints served to mask out
all undesirable areas. The final result is a suitability map depicting
a range of values where each cell is ranked according to its performance
for each weighted factor.
 In creating a grizzly bear habitat capability model,
key factors and one constraint
In creating a grizzly bear habitat capability model,
key factors and one constraint
were identified and data sets obtained. Criteria
are defined as parameters, or evidence, in relation to a decision that
can be measured and evaluated. Two types of criteria are
factors, which can either detract or enhance from the suitability
of an alternative, and constraints, which
limit or prevent that alternative. The only constraint identified
in this analysis was large bodies of salt water including fjords and the
ocean. Key factors were selected based upon well documented needs of
grizzly bears seasonally related to food sources, ideal vs. altered habitat,
and the influence of human elements of the landscape. This study
highlighted habitat structures of low elevation old growth valleys, avalanche
chutes, estuaries and sedge grass. It recognized the importance
of salmon bearing streams as a key component of grizzly diet. It also
emphasized the negative effects of human settlements and regions of human
influence, including habitat alteration such as logging.
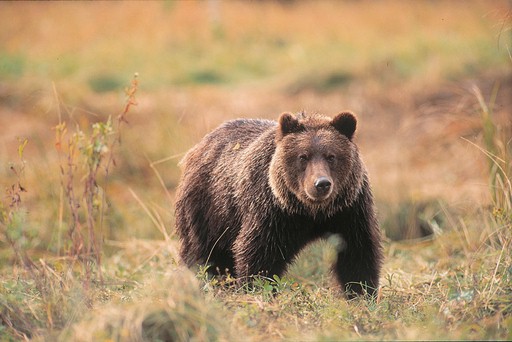
Grizzly Bears in the Khutzeymateen study spent most of their
active period on lower slopes or valley bottoms and in all seasons, actively
selected habitats for feeding and bedding though these choices varied seasonally
(MacHutchon, 1993). The preferred and most heavily used habitats were
consistently lower slopes and valley bottoms including both non-forested
and forested habitats. Flood-plain old growth, wetlands and estuaries
were all heavily used. The Bone Creek study (Saxena, 1999) reported
that the species' most limiting life requisite for modeling purposes is the
presence of spring habitat when bears descend to low-elevation wetlands and
open forests for foraging needs. This study further emphasizes the
importance of late summer and fall foraging habitats and the availability
of high-energy forage available in higher elevation study areas adjacent
to the study site. Denning activity was anticipated to be focused
at higher elevations. Numerous studies recognize the importance of
human alteration of the landscape and mortality on habitat selection by
grizzly bears. Primm (1996) argues that the human caused mortality
issues are the most important factor for understanding the conflict over
grizzly bear management, though they also be among the most complex and difficult
to analyze.
These 7 factors were imported into Idrisi, converted
from Vector to Raster format and then reclassified. In some instances
multiple themes were overlayed and again reclassified to create Boolean
images representing the desired elements. With the exception of the
slope factor, which was analyzed using Surface, a distance operation was
performed on each boolean image. Fuzzy from the Decision Support
Module then used to create fuzzy based logic classifications that rated
each pixel cell according to its suitability for grizzly bear habitat.
Factors and Constraints
:
 This factor
in the analysis attempted to classify the landscape based on an estimation
of how suitable a raster cell was in terms of habitat quality to grizzly
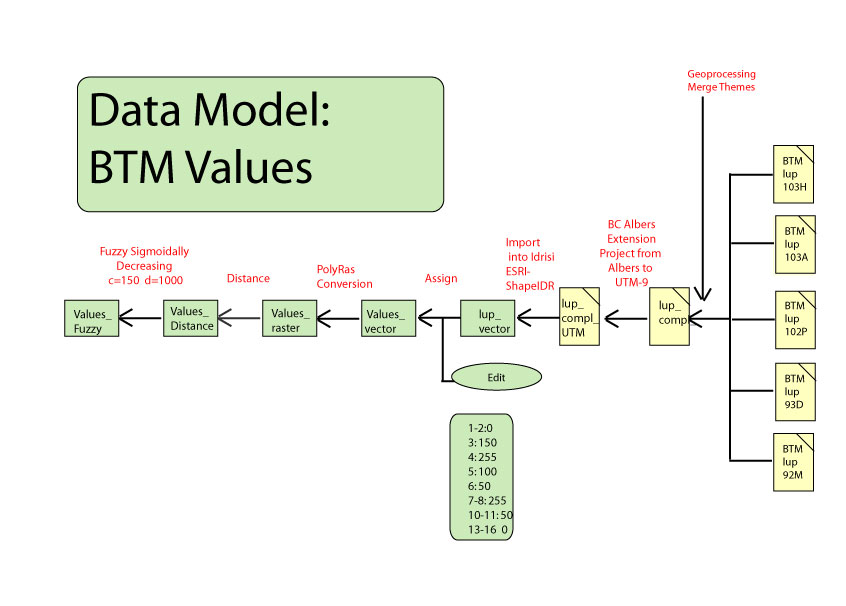
bears. The original data was the BTM data that identified 19 land
use classifications in the region. These were then reclassed according
to an estimation of how suitable each general land type would be for habitat
purposes. Land types ranking high in terms of grizzly
bear habitat (old forest, sub alpine avalanche, estuaries and wetlands)
were given the highest values of 255. Land types that provided some
habitat or connectivity corridors, such as alpine and young forest, were
ranked moderately at 150. Land types that represented little use
in terms of habitat, but did not represent negative factors were given
the value 100 (selectively logged forest and barren surfaces). Land
types that represented a barrier to grizzly bear movement or habitat were
given the low value of 50 (recently burned, glaciers and snow, recently
logged). Finally, land types representing a constraint to grizzly
bear habitat were given a nil value (urban, residential, agriculture,
mining, range and water).
This factor
in the analysis attempted to classify the landscape based on an estimation
of how suitable a raster cell was in terms of habitat quality to grizzly
bears. The original data was the BTM data that identified 19 land
use classifications in the region. These were then reclassed according
to an estimation of how suitable each general land type would be for habitat
purposes. Land types ranking high in terms of grizzly
bear habitat (old forest, sub alpine avalanche, estuaries and wetlands)
were given the highest values of 255. Land types that provided some
habitat or connectivity corridors, such as alpine and young forest, were
ranked moderately at 150. Land types that represented little use
in terms of habitat, but did not represent negative factors were given
the value 100 (selectively logged forest and barren surfaces). Land
types that represented a barrier to grizzly bear movement or habitat were
given the low value of 50 (recently burned, glaciers and snow, recently
logged). Finally, land types representing a constraint to grizzly
bear habitat were given a nil value (urban, residential, agriculture,
mining, range and water).

Old growth forest, with its structurally diverse and open canopy,
provides an abundance of food sources for grizzly bear (Jeo, 1998, MacHutchon,
1993, Saxena, 1999). This factor attempted to emphasize the importance
of old growth structure for grizzly bear habitat, foraging and denning
using BTM data's old forest classification. Unfortunately, the government's
old forest classification does not delineate old growth structure from
old forest structure. This is a serious limitation to this factor's
usefulness as the old growth characteristics most useful for grizzly bear
habitat are not distinguished from those only marginally useful.
Low elevation forested riparian zones contain the majority of bear activity
due to high species diversity, presence of fish and opportunity for day
bedding.
* Lup BTM layer was
reclassed so that 9 = 1 and all other values = 0.
* Disance and then Fuzzy was run
using a sigmoidally decreasing set where c=150m and d=1000.
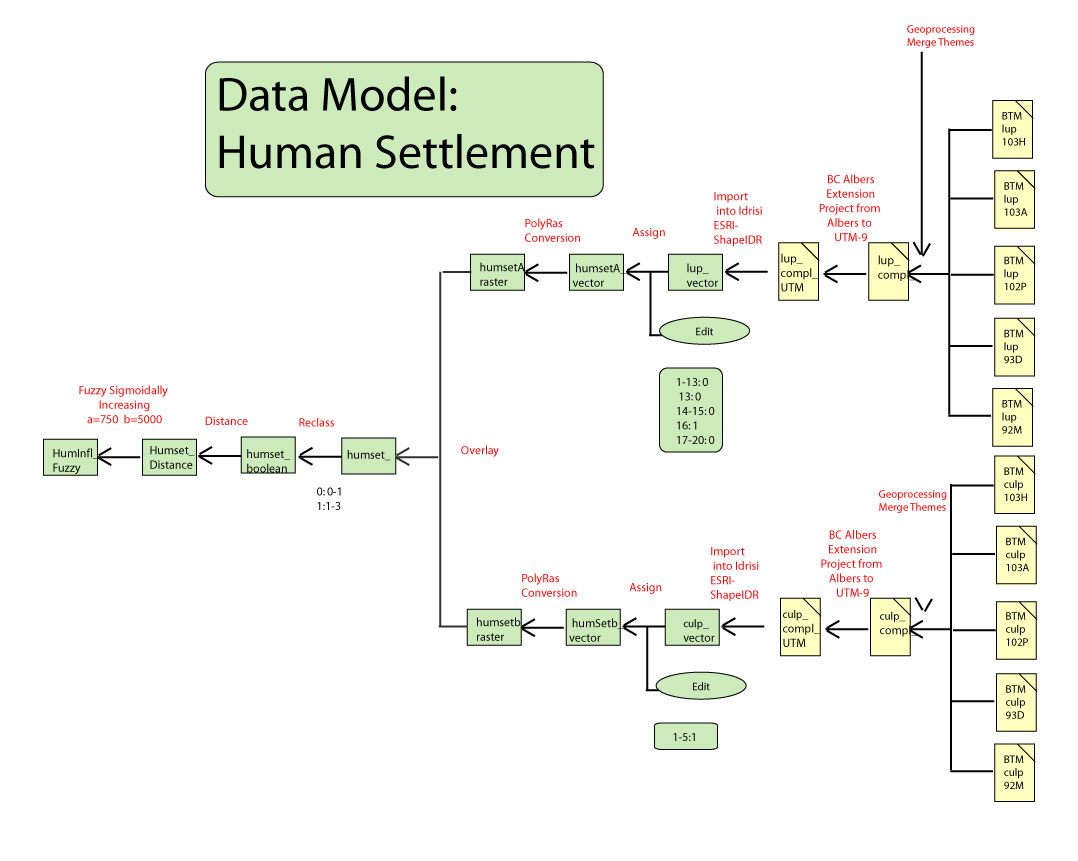
This factor included data from two layers of the BTM
data. The LUP layer detailing land use designations was used to
indicate the location of all urban settlements greater than 15ha.
This data was combined with the CLUP point file listing the location
of all villages, towns and buildings which included locations smaller
than the minimum mapping unit of the LUP layer.
In order for people to kill grizzly bears, they
need to be able to get to them. Roads, camps, villages and other sites
that bring people close to grizzly bears generally lead to contact, conflict
and bear deaths (Primm, 1996). Implicit in this factor is the access
opportunities relevant to the issue of hunting (McLellan, 1999 & Wielgus,
2001). Between 55-75% of grizzly deaths are caused by humans (Jeo,
1998). This number reflects the hunting (89%), animal control (8%),
illegal poaching (2%) and road kill(1%). (Austin, 2002) In
regions where there is human-bear contact there are even higher numbers
of 'problem bears' killed (McLellan, 1999). These interactions are
considered in the following three factors as detracting from the suitability
of the area. The Round
River (Jeo, 1998) suggests that bears avoid 400-2000m of human sites
and up to 5 km in areas known for high
hunting mortality.
* Lup BTM layer reclassified so that 13 & 16 = 1.
All Clup values were reclassified to
1.
l
* These two layers were overlayed and reclassed to form
a boolean image
* Disance and then Fuzzy was run using a sigmoidally increasing set where
a=750m and b=5000m
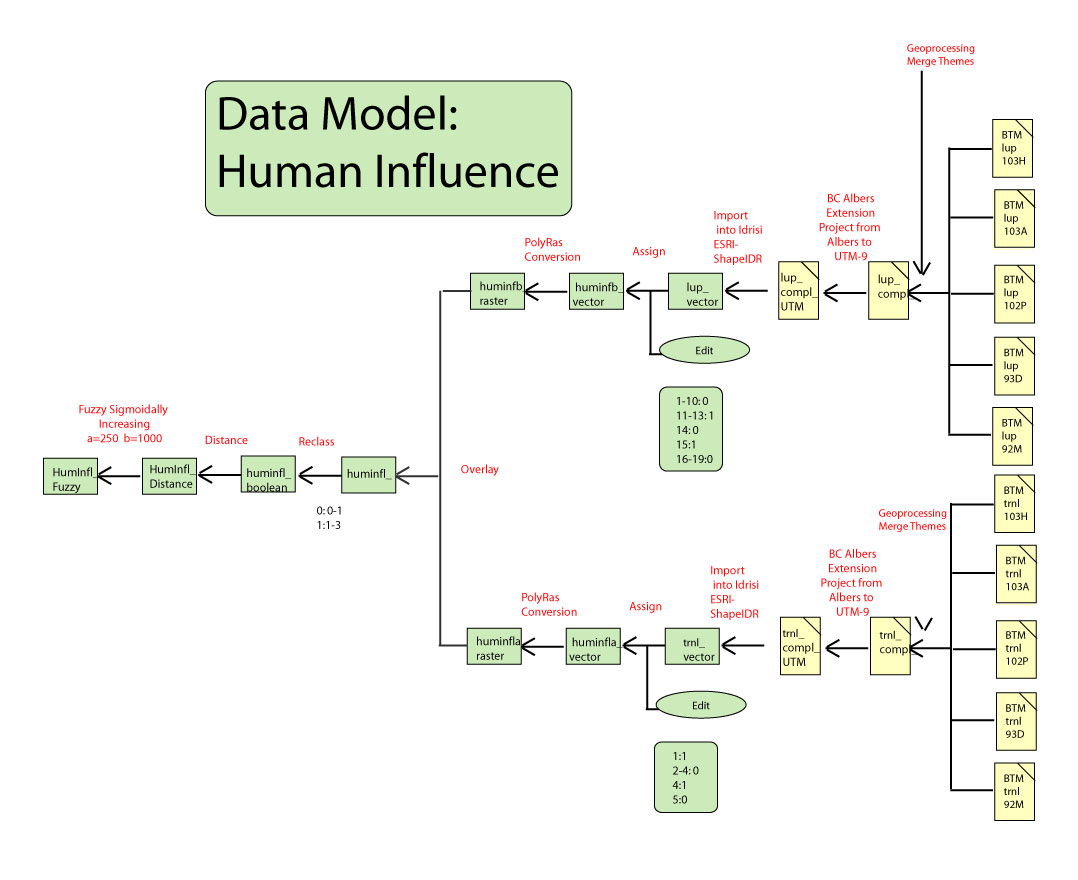
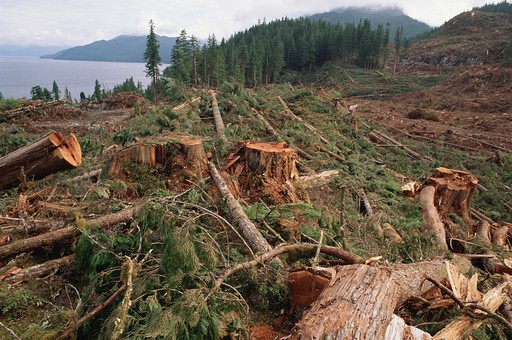
This factor included data from three layers of the BTM
data. The LUP layer detailing land use designations was used to
indicate the location of all recreation areas, recently logged and selectively
logged areas, and mining locations greater than 15ha. This data was
combined with the TRNL line file listing trails and cart tracks in the
region. This data was also combined with the TRNP point file that
listed the location of all airstrips and sea anchorages. There are
numerous studies documenting the extreme under use of modified habitats (Jao,
1998. McLellan, 1999) and problems associated with increasing encroachment
by humans into grizzly bear habitat (Hood, 2001). Hood suggests that impact
should be evaluated up to 500m.
* Lup BTM layer reclassified so that 11,12,15
= 1, Trnl layer was reclassified so that 1,4=1, trnp was reclassified
to 1.
* These three layers were overlayed and reclassed to form a boolean image.
* Distance and then Fuzzy
was run using a sigmoidally increasing set where a=250m and b=1000m.
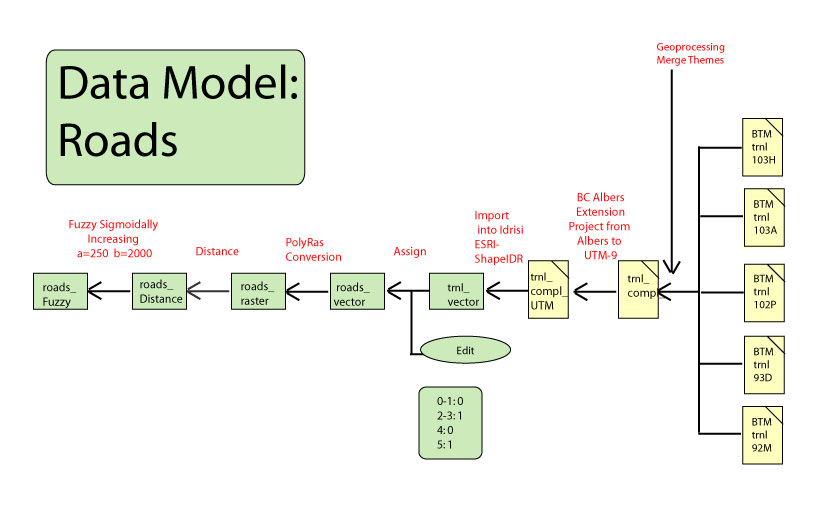 This factor
attempts to recognize the negative impact roads have on grizzly bear
habitat. Ideally, a data set indicating the density of roads,
including logging roads, would be the most useful. However this
form of data is linked to polygon shapes, generalized from regions, and
was unavailable for this study. Therefore a layer indicating the
location of all gravel and paved roads was used, TNRL, from the BTM data.
Landscape fragmentation is greatly influenced by the presence of roads
and road density is a good indicator of the ecological value of an area.
For this reason, roads and road density are referred to as "keystone
disturbances" (Jao, 1996).
This factor
attempts to recognize the negative impact roads have on grizzly bear
habitat. Ideally, a data set indicating the density of roads,
including logging roads, would be the most useful. However this
form of data is linked to polygon shapes, generalized from regions, and
was unavailable for this study. Therefore a layer indicating the
location of all gravel and paved roads was used, TNRL, from the BTM data.
Landscape fragmentation is greatly influenced by the presence of roads
and road density is a good indicator of the ecological value of an area.
For this reason, roads and road density are referred to as "keystone
disturbances" (Jao, 1996).
* Trnl BTM layer reclassified
so that 2,3,5 = 1.
* Disance and then Fuzzy was run using
a sigmoidally increasing set where a=250m and b=2000m.
 Factor 6:
Salmon
Click here to see data model
Factor 6:
Salmon
Click here to see data model
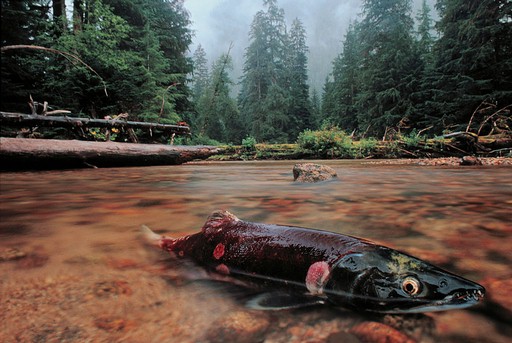
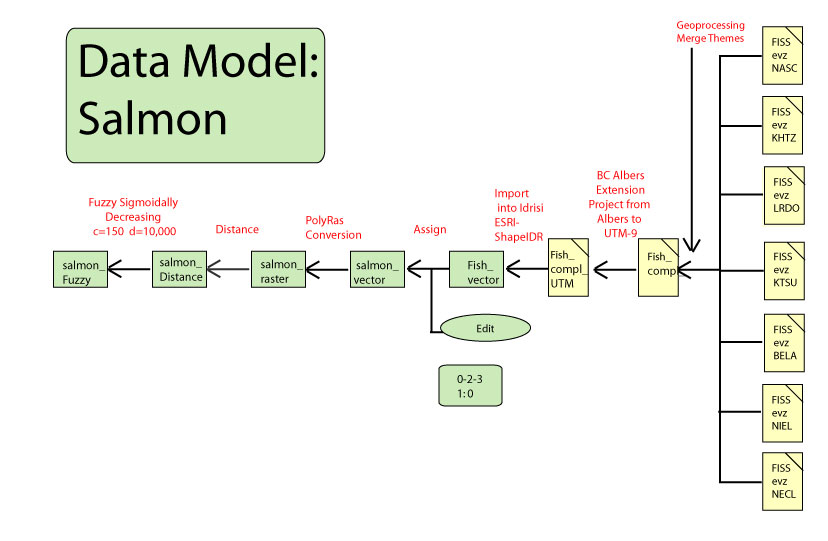
Salmon are the
most important source of meat for grizzly bears and the availability of this
food source greatly influences habitat quality for grizzly bears at both the
individual level and the population level (Hilderbrand et al, 1999).
Salmon are described as a keystone species, a species that plays a
disproportionately large role in the ecosystem function (Jao, 1996).
Salmon are also increasingly related to the nutrient cycling and trophic
interactions in forested ecosystems adjacent to salmon streams (ibid).
Salmon provide an essential food source for the grizzly bear when
they are spawning. This food source is particularly important for
its high fat content prior to denning for the winter.
* Evzl FISS layer was reclassified so that 1 = 1, all
others reclassed to 0
* Disance and then Fuzzy was run using a sigmoidally decreasing set where
c=150m and d=10,000m
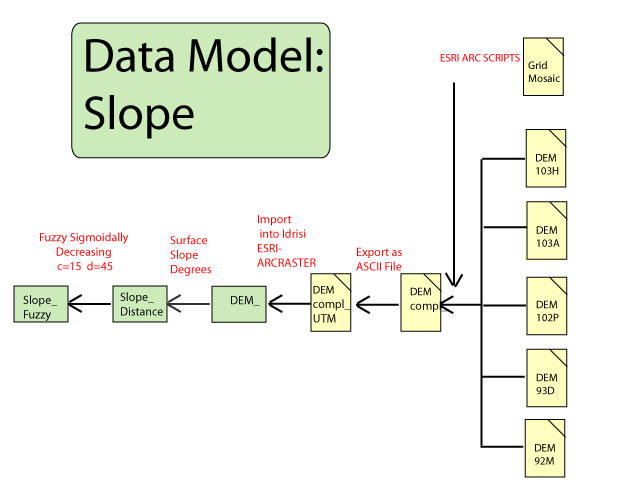
Grizzly bear prefer broad forested valleys although they often
will use steeper slopes for denning sites. Slope was calculated
from the DEM and areas less than 15 degrees were given highest values
with a sigmoidally decreasing function up to 45 degrees. This was
a difficult factor to model because grizzly bears also require steep broken
terrain for denning caves (>30 degrees).
* Surface
was run on the DEM.
* Fuzzy was run using a sigmoidally
decreasing set where c = 15 and d = 45.
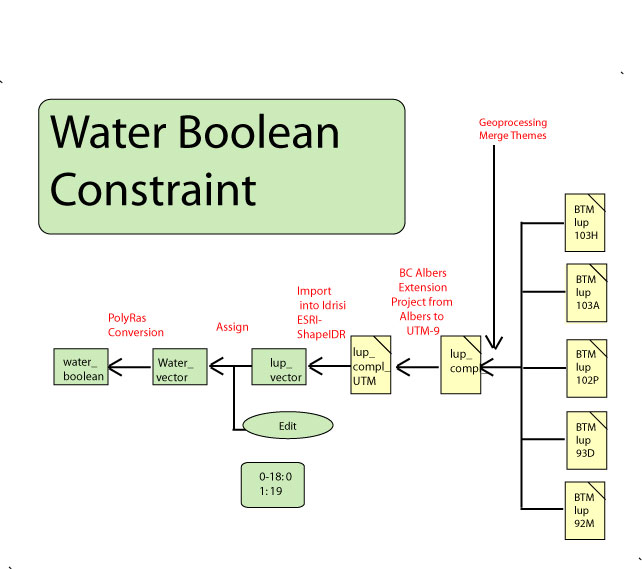
Constraint: Water
The only constraint applied in this data model was a
boolean image of locations of major fjords and the ocean in order to eliminate
non-land surfaces
* Lup BTM layer reclassified so that only 19 = 1
Performing Multiple Multi-Criteria Evaluations
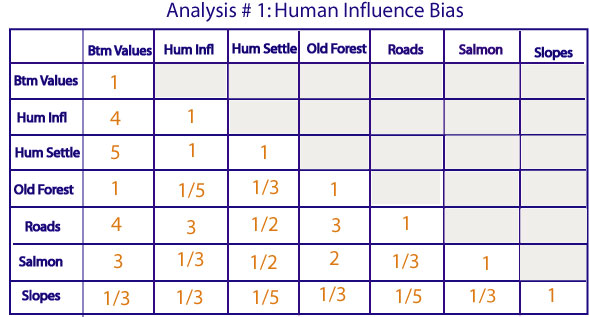
 Analysis # 1 Human influence bias: The first analysis
weighted heavily the factors that were seen to negatively influence grizzly
bear habitat. The factors of human settlement, human influence and
roads were therefore heavily weighted in the analysis. Land
use values were not rated highly because they were interpreted to contribute
to habitat quality.
Analysis # 1 Human influence bias: The first analysis
weighted heavily the factors that were seen to negatively influence grizzly
bear habitat. The factors of human settlement, human influence and
roads were therefore heavily weighted in the analysis. Land
use values were not rated highly because they were interpreted to contribute
to habitat quality.
Analysis # 2 Neutral position: This analysis attempted to
adopt a more neutral position and to allow for selected factors to stand
more evenly against one another. A few differences were highlighted,
such as the relative importance of human settlements over human influence
and the importance of salmon over all other factors.
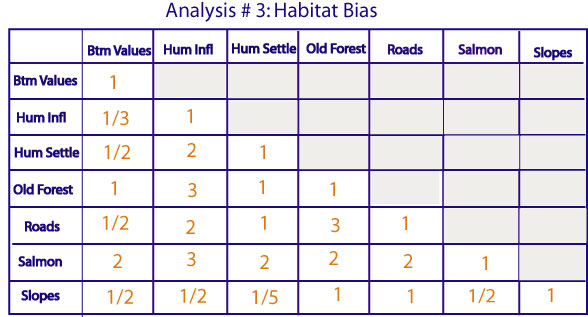
Analysis # 3 Habitat bias: This analysis weighted heavily
the factors that were seen to have a strong positive contribution
to grizzly bear habitat.
