Effectiveness of GIS in assessinggrizzly

grizzly GRIZZLY BEAR HABITAT

In the Central Coast of British Columbia.


Problems and Limitations of Research:

    The limitations of this research design falls into three broad classes.  These are the limitations and uncertainty resultant from the data sets used, the limitations of the decision making process and the use of the raster based system.  Uncertainty is inevitable when representing spatial surfaces, regardless of the precision, scale and accuracy of the data set.  The degree to which uncertainty and risk are propagated and expressed in terms of these factors is what is relevant to the decision making process. 
    The quality of initial data can influence all later stages in the research design.  Highlighting the difficulty in the dataset designed to show the old growth factor, it is quite evident how the inability to distinguish between old growth and old forest could seriously influence the overall outcome of the analysis.  Spies and Franklin (1991) define old growth based on qualities of structural diversity, species diversity and age classes of 150-250 years while the BTM data looked at age class of greater than 140 years and heights of over 6m.  If, as many would indicate, old growth structure in the central coast is a limiting factor, then the definition of old growth can greatly influence the analysis and resultant GIS data (Norheim, 2002).  The temporal accuracy of the BTM data is problematic as it dates from 1992-1994 Land Sat imagery.  This type of analysis demands temporally accurate data to effectively advise policy as much has changed over the past decade in terms of timber used and development of human infrastructure (roads, villages.)  
    The data used in this analysis were produced by the provincial government of BC for internal and ministry analysis.  The data is made available to the public, but is collected by the standards and criteria laid out by the government.  The data used in this analysis, with the exception of the DEM, originated in Vector format.  An additional data set that would have greatly enhanced the effectiveness of the model representing habitat was not used because the database structure would have required lengthy transformation in order to use in a raster format.  Much of the province's classification scheme is built on a hierarchical structure that further divides regions.  The data base reflects this structure and a single 100 m. region could have up to 5 fields describing its ecological properties.  For this analysis, the integration of at least three if not four of these fields would have been necessary to deduce land cover, seral stage and ultimately a single pixel value of suitability for one criteria.  This was unsuccessfully attempted numerous times and was abandoned for a future vector based analysis. 
    The scale of the analysis was based upon the 30m DEM and this seemed to be an appropriate level of analysis.  Although certain important features were undoubtedly lost, using a smaller scale would have resulted in unnecessarily large files.  All of the MMU's used in this analysis are larger than 30 m.  This selection of scale is related to problems encountered in terms of processing speed and enormous file sizes that represented nightmare storage issues for both the researcher and individuals responsible for monitoring students usage of data space.  (!)
    The uncertainty within the original data set was documented in the meta data and did not exceed the spatial scale of this analysis because most of the data was generalized to the 1:250,000 map sheets used in this analysis.  The selection of data sets used represented a much larger source of potential error as did generalizations in the weighted analysis of the MCE's.  To attempt address uncertainty within the decision making process weighted linear analysis was used instead of a Boolean approach and fuzzy analysis was used to rank factors instead of crisp boundaries. 
forest logs       
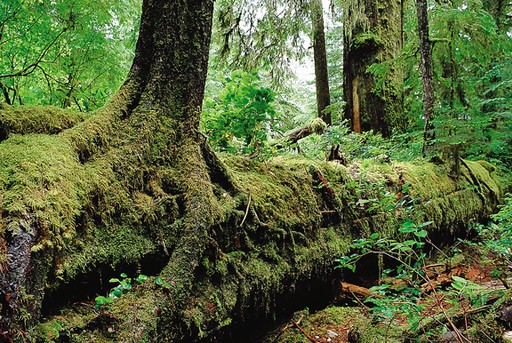
Research on this subject is dominated by vector based analysis reducing the opportunity to compare this research methodology with other raster base GIS grizzly bear habitat models.  The use of vector based studies allows for criteria to be more easily established, including road density and percent of logging in a watershed.  Furthermore, many researchers argue that the level to look at grizzly bear habitat is the watershed because grizzly bear are mobile animals with large home ranges and diverse habitat requirements. 
    A vector based research design would be better able to determine if a watershed contained all of the ideal habitat requirements, where as a raster based image would only be able to provide a distance analysis of proximity to a particular feature, or to reclass the entire watershed based on a single value.  The advantages to the raster based analysis are numerous in terms of the fuzzy logic and ability to perform weighted linear function.  


Conceptual idea    Introduction    Data Collection      Project Design      Spatial Analysis     Conclusions    Problems
 
Bibliography

back to index