|
Home
|
Introduction
|
Data
|
Methodology
|
Spatial Analysis
|
conclusions
|
Problems/Suggestions For Further Research |
Data
DATA ACGUISITION AND MANIPULATION
The GIS coverage I used for this analysis was a shape file of Census Sub Divisions for the GVRD provided by Census Canada. To create a raster image to perform my analyses in Idrisi, I used the spatial analyst extension in Arcview to make a grid.apr project file. I then created an export file: xport.asc (ASCII data). In Idisi, under import, I used ARCRASTER to bring the xport.asc file into Idrisi and convert the ASCII raster data into Idrisi format.
The attribute data I used for this project was all from Census Canada, downloaded into microsoft access and directly readable in Arcview. The Census variables I used were:
1. Total employed labour force 15 years and over by place of work status (20% sample data) Usual place of work:
· In CSD of residence
· In different CSD
2. Total employed labour force 15 years and over by mode of transportation (20% sample data)
· Car, truck, van as driver
· Car, truck, van as passenger
· Public transit
· Walked to work
· Bicycle
3. Total number of occupied private dwellings by structural type of dwelling (20% sample data)
· Single-detached house
· Semi-detached house
· Row house
· Apartment, detached duplex
· Apartment building, five or more storeys
· Apartment building, less than five storeys
4. Avrerage Income.
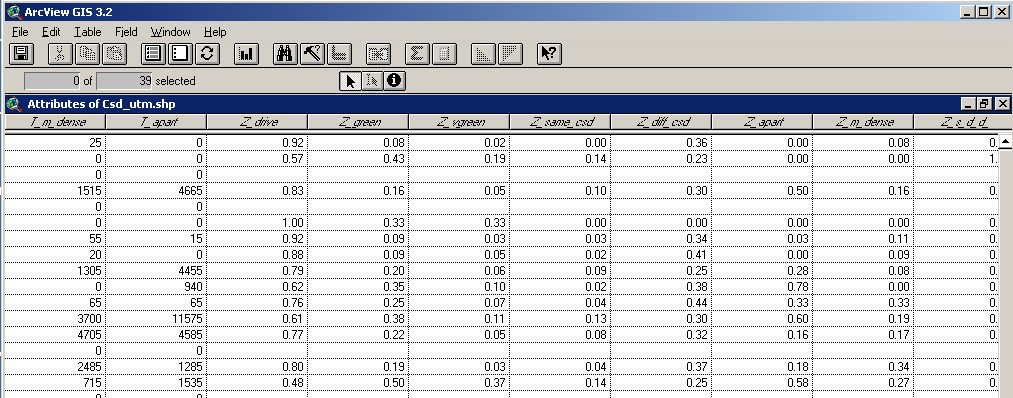
The above attributes were all contained within the same attribute table in Arcview. I then started editing and manipulating the data to form fields in the attribute table that would be useful for my analysis: First, I created new fields for mode of transportation and number of occupied private dwellings by structural type from the existing fields:
· Green modes = Car, truck, van as passenger + Public transit + Walked to work + Bicycle
· Very green modes = Walked to work + Bicycle
· High dense dwl. = Apartment building, five or more storeys + Apartment building, less than five storeys
· Medium dense dwl. = Semi-detached house + Row house + Apartment, detached duplex
I then created the eight new fields to be used later as individual raster layers or factor images in Idrisi for my analyses. These fields are:
1. %_green = green modes / Total employed labour force 15 years and over by mode of transportation
2. %V_green = very green modes / Total employed labour force 15 years and over by mode of transportation)
3. %Drive = Car, truck, van as driver / Total employed labour force 15 years and over by mode of transportation
4. %same_csd = In CSD of residence / Total employed labour force 15 years and over by place of work status.
5. %diff_csd = In different CSD / Total employed labour force 15 years and over by place of work status.
6. %H_dense = High dense dwl. / Total number of occupied private dwellings by structural type of dwelling.
7. %M_dense = Medium dense dwl. / Total number of occupied private dwellings by structural type of dwelling.
8. %L_dense = Single-detached house / Total number of occupied private dwellings by structural type of dwelling.
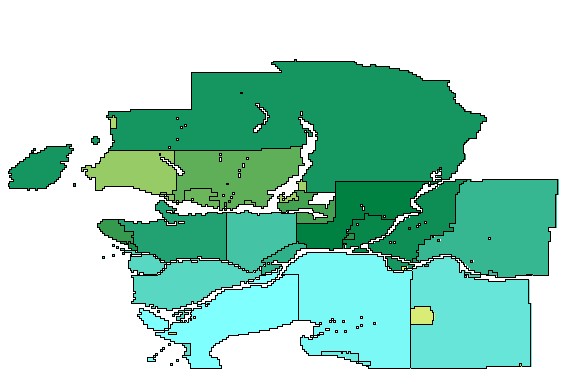
After the editing of the attribute table csd.shp was completed in Arcview, I went into Idrisi and used the data base manager to import the csd.shp attribute table which, upon saving it, became csd.dbf. I was now able to start creating my individual raster images with which to perform the analysis. To do this, I first created attribute values files for each of the factors to be considered in the analysis. I then used assign to join the raster image csd_raster with each .avl file to create a raster layer for each factor. Because these raster images themselves showed how the individual factors being analyzed were spatially distributed throughout the GVRD, I reclassed them into 5 categories to produce images showing the spatial distribution of these factors, by CSD, throughout the GVRD.