|
Home
|
Introduction
|
Data
|
Methodology
|
Spatial Analysis
|
Conclusions
|
Problems/Suggestions for Further Research |
Multi Criteria Evaluation: The Weighted Linear Combination (WLC).
After standardizing all my factors to a continious scale, and then weighting these factors for aggregation, I was then ready to aggregate the factors using WLC. This will produce a final image that is an aggregate measure of sustainability ranging from 0-255 for each the CSD's in the GVRD. In Idrisi, I used MCE to run the Weighted Linear Combination option and retrieved the parameter file (the decision support file sustainability.dsf ). I then ran the module to produce the MCE image, mce_sustainability_results.
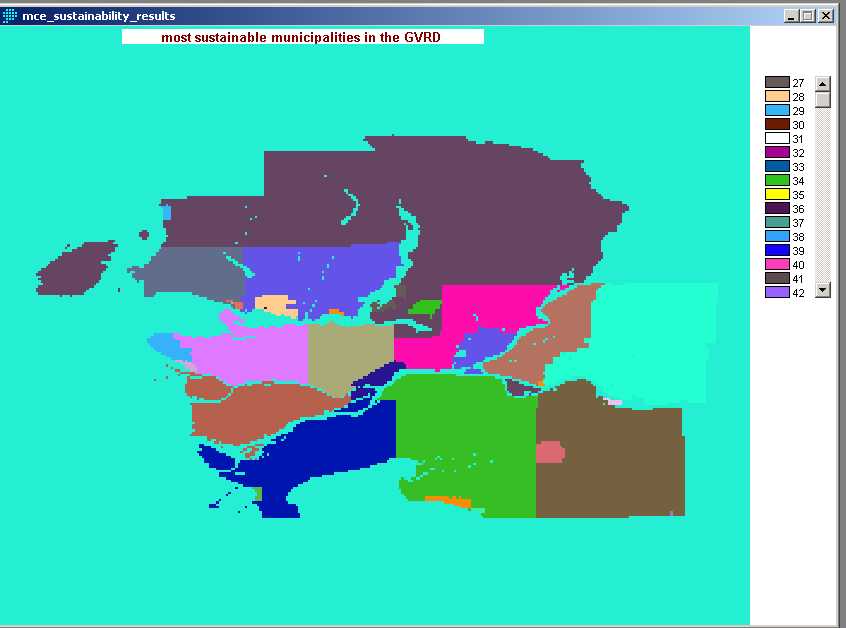
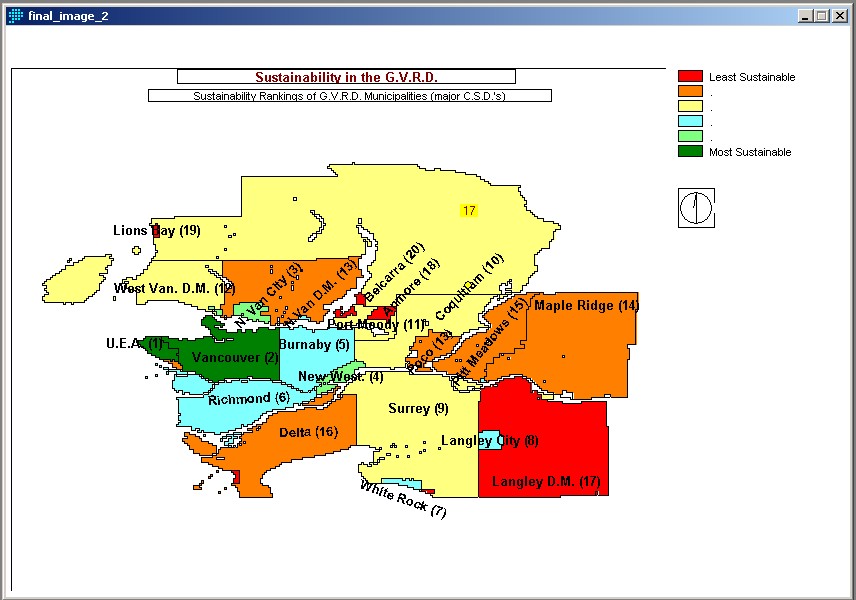
This image shows all of the CSD's in the GVRD with thier sustainability scores. However, the legend scaled itself from 27, the lowest sustainability score, to 184, the highest, resulting in way to many legend categories and an unclear graphic display. The final step was to produce a usefule graphic display that communicates the results of this sustainability evaluation and comparison. I used re-class to create an map image with six categories of sustainability. I also created a vector layer showing the boundaries of the CSD's, and digitized the names of the major CSD's along with thier rankings.
STATISTICAL ANALYSIS
Having determined which are the most/least sustainable CSD's in the GVRD, we can run some statisical analyses to see what, if any correlation there is between factors. One correlation that is interesting to explore is that between income and sustainability. Is there any correlation between income and sustainability? To answer this, I first created a factor image of average income by CSD. I then was able to use the REGRESS module to perform a regression analysis to determine what, if any, the correlation is between these two factors. Click HERE to see the cartographic model showing these steps. The correlation coefficient can vary from very from -1.0 (strong negative relationship) to 0 (no relationship) to + 1.0 (very strong positive relationship). The correlation coefficient r = -.907308, and the clustering of points along the trend line sloping downwards from left to right, shows that there is a strong negative or inverse relationship between sustainability and income, ie, those CSD's that have the highest incomes tend to also have the lowest sustainability scores (gosh, how suprising!).
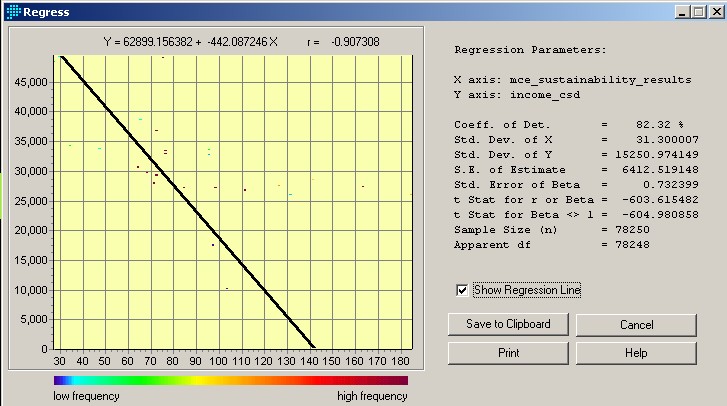
This might suggest that, at least in this instance, wealth affords the right to pollute. Or perhaps less cynically (and equally as simplistically), wealthy people tend to be less sustainable than thier less wealthy fellow citizens! Okay, this is jumping to conclusions a bit, but is certainly seems to be what the regression analyses is showing.
Another useful relationship to acess is the relationship between commuter modes and dwelling densities. As has been commonly cited in sustainable design literature, a low density, horizental urban form will increase automobile dependancy. I will conduct a regression analyses to see if there is a relationship between low desnity and automobile dependancy, ie, between high %'s of commuters who drive, and high %'s of lowdensity dwellings. To do this, I will use the drive_fuzz and L_dense_fuzz raster layers created earlier in the project to perform a regression analysis.
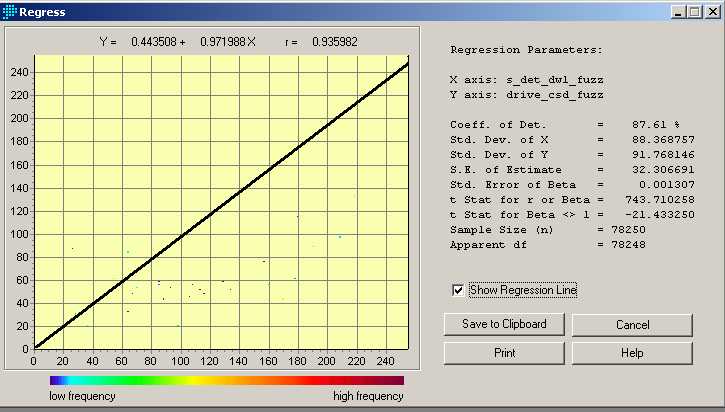
As the regression model shows, there is a very strong positive relationship between a low-density, horizental urban form and automobile dependancy in the GVRD.