|
Home
|
Introduction
|
Data
|
Methodology
|
Spatial Analysis |
Conclusions
|
Problems/Suggestions for Further Research |
SUSTAINABILITY RANKINGS OF GVRD MUNICIPALITIES (MAJOR CSD's)
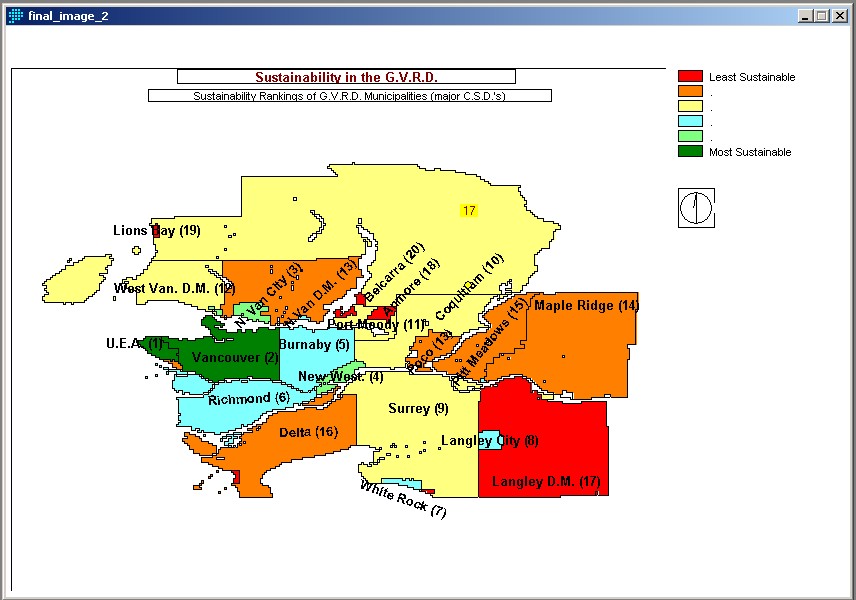
With the resulting image produced with the MCE module, I was able to determine a ranking of GVRD CSD's based on the index of factor's I developped and used to evaluate sustainability in the GVRD. On a scale of sustainability from 0-255, and based on the 8 weighted sustainability factors, the highest sustainability score was 184 while the lowest was 27. The following is a list of the CSD's in order of thier sustainability ranking along with thier sustainability score:
|
1) University Endowment Lands (184) |
| 2
)Vancouver (163) |
| 3)
City Of North Vancouver (141) |
| 4) New Westminster (126) |
| 5) Burnaby (111) |
| 6) Richmond (98) |
| 7) White Rock (95) |
| 8) Langley Township (90) |
| 9) Surrey (84) |
| 10) Coquitlam (77) |
| 11) Port Moody (76) |
| 12) District Municipality of West Vancouver
(75) |
| 13) District Municipality of North Vancouver
(72) |
| 14) Maple Ridge (71) |
| 15) Pitt Meadows (68) |
| 16) Delta (64) |
| 17) District Municipality of Langley (53) |
| 18) Anmore (34) |
| 19) Lions Bay (29) |
| 20) Belcarra (27) |
As the results show, Vancouver, New Westminster, the City of North Vancouver, and Burnaby were rated the most sustainable cities in the GVRD by this evaluation/comparison model. These results are interesting in that they show that the most urbanized and high desnity areas are those that are the most sustainable. Conversely, the outlieing suburbs and rural residential areas, areas often associated with notions of purity and clean living, were determined to be considerably less sustainable by this model, particularly Delta, the District Municipality of Langley, Pitt Meadows and Maple Ridge.
The results produced by the sustainability evaluation and comparison model were useful in three significant ways. First, they gave us a picture of overall sustainability in the GVRD based on the factors developped and criteria chosen for this project. Second, each sustainability factor was used to create an individual map layer that displayed graphically how each factor is distributed throughout the GVRD by CSD. Finally, I was able to use the sustainability results to conduct two regression analyses, one which studied the possible causal relationships between sustainability and other independant factors, and the other which studied the causal relationships between the individual factors involved in the analyses. Perhaps most useful were the individual factor images as they showed visually commuting trends as well as dwelling density patterns, creating a more detailed analysis of the regions sustainability (or lack there of). Most interesting were the results of the regression analyses that showed strong correlations between income and sustainability, and automobile dependancy and low-density residential development.