|
Home
|
Introduction
|
Data
|
Methodology
|
Spatial Analyses
|
Conclusions
|
Problems/Suggestions for Further Research |
Methodology
|
CARTOGRAPHIC MODEL
|
|
(note: microsoft word will be needed to view the cartographic model)
|
To review, the purpose of this project is to create a model to analyse, evaluate and compare sustainability of major CSD's (cities, townships, municipalities) in the GVRD. To develop this model, I first created an index of factors that would be used as the evaluative framework to measure and compare sustainability in the GVRD. As noted in the introduction, the factors considered in this model are related to commuter modes of transportation and residential dwelling type (density).
Factors related to commuter modes of transportation are essential to consider in evaluating sustainability as pollution produced varies considerably from mode to mode. Also, as commuter modes are often determined by community design, for example high densities are needed to support transit, and mixed use, 'complete' communities will increase walking and biking as commuter options, commuter trends can suggest the degree to which the design of a particular community is 'sustainable' (Beatley and manning). Further, where one works is an important measure of sustainability, as the further one has to travel to work, the less likely they are to walk or bike, or possibly, even use transit. Working in the same residence one resides in is an indication of how mixed-use or complete, and therefore how sustainable the community is.
The factors related to dwelling density were chosen as follows. I choose to use the percentage of total dwellings that were either high, medium, or low density (to be defined below) out of the total number of dwelling units in each study area (CSD) as a measure of dwelling density and therefore sustainability. Higher dwelling densities, defined here as size of dwelling unit, are more sustainable as they consume less land area, require less energy to heat and maintain, and can result in higher density population clusters necessary to support transit. I chose not to simply use population density as a measure of sustainability as this is simply a measure of population per area, ignoring the presence of open and undevelopped areas. (However, incorperating population density into the dwelling density factor would be useful and is discussed further in the section suggestions for further research). CSD's where there were high proportions of high and medium density dwelling units were given higher sustainability scores. In other words, the higher the proportion of total dwelling units that are high density, the higher the sustainability score.
As transportation and land-use are directly related, dwelling densities will affect mode of transportation. This will be discussed later in the project.
The list of sustainability factors considered for each census sub division can be broken into 2 groups as follows:
Transportation
1) % of commuters residing in same CSD as work. (high % yields higher sustainability score)
2) % of commuters residing in different CSD as work. (high% yields lower sustainability score)
3) % of commuters using 'green' modes of commuter transport. (high %, higher sust. score).
4) % of commuters using 'very green' modes of commuter transport. (high %, higher sust. score)
5) % of commuters who drive to work. (high %, low sust. score)
Dwelling type
6) % of dwellings that are high density. (high %, higher sust. score)
7) % of dwellings that are medium density.(high %, higher score).
8) % of dwellings that are low density. (high %, lower sust. score).
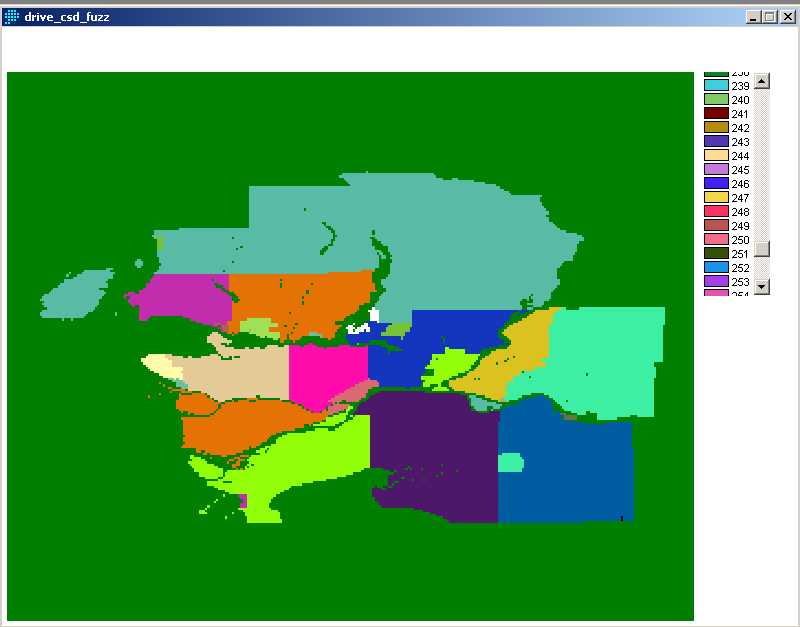
These factors were then all transformed into factor images that are individual raster layers by creating .avl files for each of the factors and then using the module ASSIGN in Idrisi. Each of these images were then re-classed using five classes so as to create useful graphic displays showing how each individual sustainability factor is distributed throughout the GVRD by CSD.
See cartographic model showing these steps.
See Images showing sustainability factors displayed as individual raster layers
These factor images were then standardized to the same continious scale of sustainability so that factors representing different criteria measured in different ways could be compared. This allowed me to aggregate the factor images.
STANDARDIZATION OF FACTORS TO A CONTINIOUS SCALE
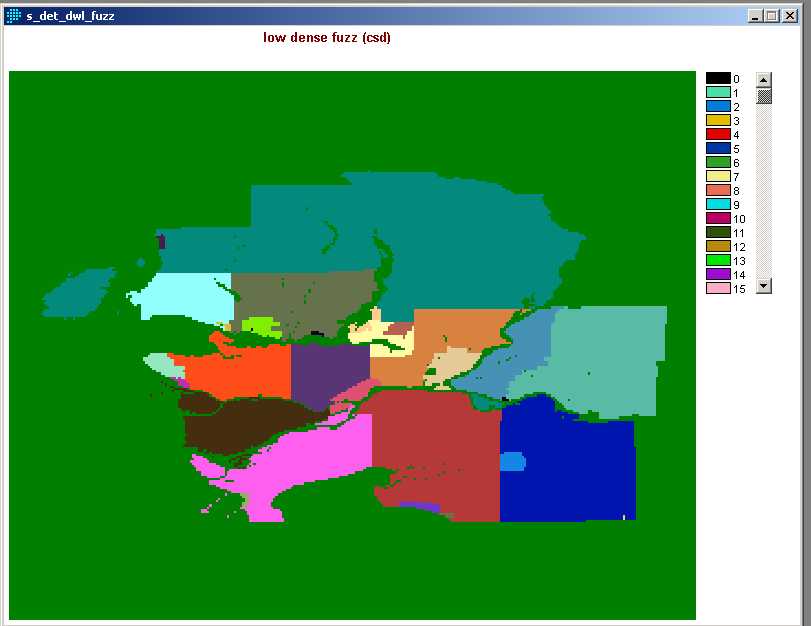
These factors were then standardized to a continious scale of 0-255 using the module fuzzy in Idrisi. The rescaling function used to standardize the factors was a simple linear stretch. The type of membership function was either increasing or decreasing depending on the factor, as shown in the cartographic model .
Because the raster layers created with the fuzzy module are not really useful as graphic displays in themselves, but are, instead, to be used to perform the final spatial analysis, I will only show two of the eight fuzz raster layers.
FACTOR WEIGHTS
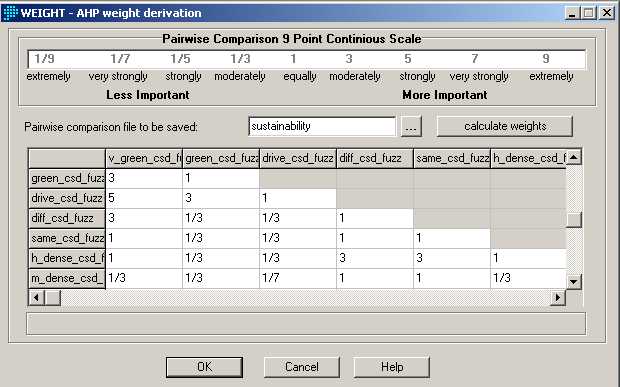
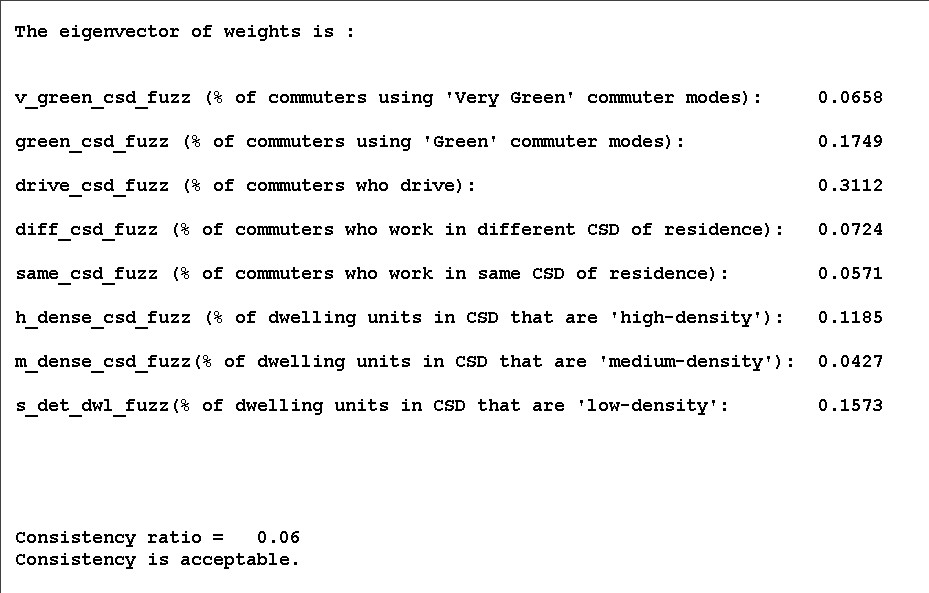
Since the sustainability factors making up the evaluative framework have a different degree of significance in determining sustainability, each of the factors in the aggregation process was given a different weight using the module weight.
The weighted factors were created using a pairwise comparison matrix, and were saved as the decision support file sustainability.dsf.
The highest weight was given to the factor drive_csd_fuzz as the % of people driving to work is the most significant factor in measuring sustainability for this analyses. In general, transportation factors were given higher weights than dwelling density factors.
Pairwise Comparison Matrix
LIST OF WEIGHT FACTORS
With all of the factors standardized and weighted, the next step in evaluating and comparing sustainability in the GVRD was the spatial analysis