 
Home
|| Political Parties
|| Polling Data
|| Ridings
|| Marginal Seats
|| Election News
|| Women & Elections
|| Election Laws
|
Party Support on Polling Days - 2008The following chart shows the levels of support found for Canadian political parties by different polling companies, represented by coloured squares for the days on which the actual interviewing occurred. Darker shades of the same colour indicate that more than one company polled on the same day and found the same level of support. Note that in reality, polling results usually vary from one day to another over the several days of interviewing for a poll. This is normal because of the small number of interviews made on each day. The most reliable research involves interviews over several days in order to better capture public opinion; results are combined over the total survey period to give the final levels of support reported for each party. 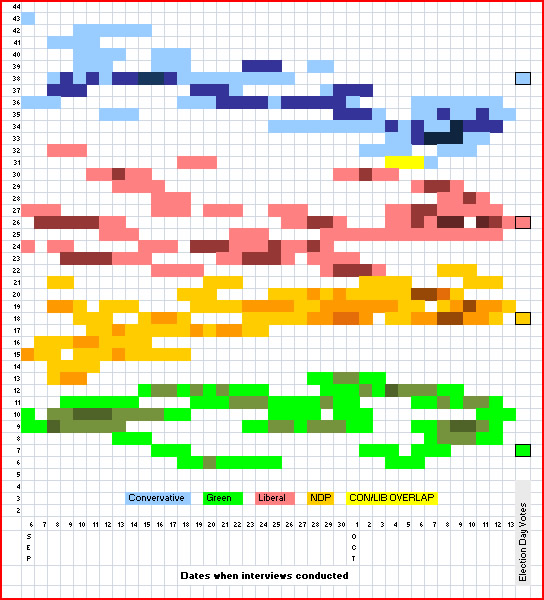
Data source: 2008 Canadian Election Polls The chart clearly shows that substantive variation can occur between polling companies conducting interviews on the same days. For example, there were 6 polls conducted in the period covering September 8-10, and yet the results span 10 percentage points for the Liberals (23-32) and nine for the NDP (13-21). Another anomaly occurs during Sep 30 to Oct 2, when 6 polls cover a 9 point spread for the Liberals (22-30). While the actual level of support could have been anywhere in that range, it is more likely to lie somewhere in the middle. Alternatively, the highest extreme poll results could have been the legendary "20th poll;" the highest is mentioned here simply because those are the ones that stand out from the rest of the poll results. Statistically, polls are reliable within their margin of error 19 times out of 20; thus it is quite possible for an occasional poll to report out of range results that do not reflect reality. Another potential example of the 20th poll is one Angus Reid conducted between Sep 10-12, which reported that the Green Party was the second most popular party in BC. This finding stands well apart from other polls of BC public opinion conducted around that time.
Return to 2008 Election Polls Page
I welcome any feedback and suggestions for fresh material to add to this site -
Andrew
Heard
copyright (c) 2008 Andrew Heard |