Home || Political Parties || Polling Data || Ridings || Marginal Seats || Election News || Women & Elections || Election Laws |
||||||||||||||||||||||||||||||||||||||||||||||||||||||||||||||||||||||||||||||||||||||||||||||||||||||||||||||||||||||||||||||||||||||||||||||||||||||||||||||||||||||||||||||||||||||||||||||||||||||||||||||||||||||||||||||||||||||||||||||||||||||||||||||||||||||||||||||||||||||||||||||||||||||||||||||||||||||||||||||||||||||||||||||||||||||||||||||||||||||||||||||||||||||||||||||||||||||||||||||||||||||||||||||||||||||||||||||||||||||||||||||||||||||||||||||||||||||||||||||||||||||||||||||||||||||||||||||||||||||||||||||
|
Apart from general information on opinion polls, this page provides tables of polling results for you to keep track of changes in voters' preferences as the next campaign unfolds. While the focus of most media attention is often on the national levels of support for the various parties, in the end the regional and local levels of support are much more indicative of how parties may fare on election day.
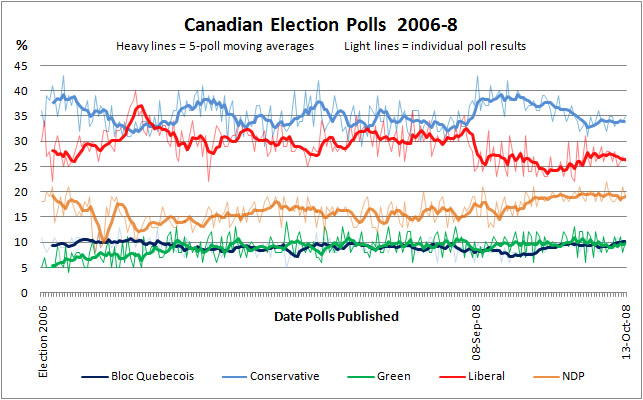
The chart above presents the poll results of many different companies. The dark lines show a moving average of 5 polls at a time, in order to smooth out the sharp and (relatively) meaningless variations that can occur over very short periods of time because of differences in each firm's polling techniques. A better idea of these variations between pollsters can be seen in a chart showing the support for parties over the days on which the surveys were actually conducted. For a better idea of how fluid public support for parties can be, look back to the evolution of public support for the parties during the 2006, 2004 and 2000 election campaigns. CPAC partnered once again with Nanos Research (formerly SES) to bring daily polling results with a 3-day moving sample. Harris-Decima is also conducting a continuous poll, with a 4-day moving average. These rolling poll results were reported in the list of polls on this page every 2-3 days, excpet ot the end of the campaign. Ekos is another polling company that conducted rolling polls on a daily basis, although their polls were not published on Sundays. CTV and the Globe & Mail hired Strategic Counsel to provide regular polling in 45 key ridings in BC, Ontario and Quebec. Their argument is that these seats are the most vulnerable and together will have a substantial impact on the outcome of the election. You can look up just how successful Canadian pollsters have been in predicting the last 3 elections - compare the support for the parties in the polls and at the polls! Election Seat Projections Just for interest sake, here are five seat predictions that provide some different outcomes. The Election Prediction Project and Democratic Space both combine user input from across the country to evaluate which party might win each specific riding across the country. The UBC Election Stock Market follows how much each party is worth monetarily to participants. All three sites have shown remarkable accuracy in past elections, especially compared to the professional agencies that have ventured seat projections.
Reflections on Polling The Library of Parliament has an interesting background paper on Public Opinion Polling in Canada. Matthew Mendelsohn and Jason Brent of Queen's University provide a useful guide to Understanding Polling Methodology - this is essential reading for an insight into just what significance we can attach to particular survey results. One thing to keep in mind is that most polls are published with the national margin of error reported; but the margin of error will be much higher for any provincial or regional figures that are also reported. The Laurier Institute has an interesting collection of material on opinion polls and electoral support for political parties as well as seat predictions based on the current polls. When reading opinion poll results pay close attention to how large the sample size and "undecided" figures are. A large sample makes for more accurate results, particularly at the regional level. A small undecided figure means that the polling company has probed with follow up questions to finding out who a person is most likely to vote for, and included them in the pool of decided voters. But these leaners, as they're known, are expressing a preference, not a decision. They can also be quite volatile and either change their party preference or even decide not to vote at all. Also be cautious in reading too much into polls that were conducted with only one day of interviewing. Generally speaking, several days of interviews are thought to be preferable in order to ensure more chance of capturing a wider range of society in the poll's sample. Because of differences in polling techniques and handling of leaners, each polling agency may develop their own structural bias that under- or over-reports support for particular parties. Nanos has tended to report a closer contest between the Liberals and Conservatives than has Harris/Decima or Ekos. For example, Nanos found only a 5 point spread in polling conducted between Sep 18-20, while Harris/Decima reported a 16 point difference in their Sep 17-20 poll and Ekos found a 13 point spread in their Sep 19-21 poll. More recently, a Nanos poll conducted Oct 2-4 showed only a 4 point spread while a Harris/Decima poll conducted Sep 30 to Oct 3 reported a 13 point spread and the Sep 30 to Oct 2 Ekos poll found a 12 point difference. Mark Pickup provides a very useful chart showing Canadian election polls with their biases corrected and margins of error mapped. This may be the best indication of the "true" levels of support. Polls conducted online are not included in this poll as they are not as accurate as polls conducted by telephone interviews. The problem with online polls is that they exclude about 25% of Canadian households that do not have Internet access and they cannot draw their list of respondents in a truly random fashion form the population. In order for polls to be fully reliable they must include as close to the total population as possible and must draw their list of potential interviews in a random order from that total population. Even telephone interviews have a small but growing problem, as they do not include the growing number of Canadians who use either cell phones or internet phones as their only phone. Undefined depth of support for specific parties A fundamental problem with media reporting on opinion polls is that there is usually little indication in the initial reports of how soft the reported support is for each party, or how each polling company tries to probe for voting intentions. Polls results often loosely proclaim "40% of decided voters... etc" However, that final figure may be based on having to prod the respondents at least twice into expressing a preference: 1) "If an election were held today which party would you vote for?" and, if they say don't know, then they are asked 2) "which party are you leaning towards voting for?" The second group are only leaning and should not be viewed as actual support, and yet most polling companies roll the leaners in with the truly decided. Moreover, even those who name a party on the first question may still be actively considering another party (or whether to vote at all). It would take other specific questions to establish that the voter has settled their choices and is not likely to switch parties. We in the public often miss the fluid nature of public opinion captured when polls are reported. It is not often clear how settled are the voting intentions reported in a poll. Thus it is useful when a polling agency releases results of questions that probe the nature of people's voting decisions. For example, a Nanos poll released in early September 2008 revealed that only 40% of the people they interviewed would describe their choice of whom to vote for as "very firm;" thus, Nanos claimed the almost 60% of votes were "up for grabs." This is something of an overstatement, however, and potential shifts are more likely to come from the 23% who were the least firm or undecided. That conclusion is consistent with the findings of an Ekos poll released on Sep 22, 2008, which revealed that only 26% of respondents said that it was likely or somewhat likely that they would change their minds. An Ekos poll conducted Oct 3-5 found that 21% of respondents were still likely to change their votes. Several polls during the 2006 election showed large numbers of voters were prepared to change their vote. The potential for voters to switch in the last days of the campaign was realized in the 2004 election, when the Liberals gained and the Conservatives dropped several points in the last 2-3 days before voting day. Because of this potential for voters to switch their choice of party or candidate, it is important to follow the polls to track the ebb and flow of public opinion during an election campaign. Ekos released an interesting poll in mid-September 2008, in which they detail how people think they will vote this time compared to the way they voted in the 2006 elections. The Conservatives have managed to retain 84% of those who claim to have voted for them in 2006, while the Liberals have the lowest retention rate at 62%. By the time of an Ipsos poll conducted Oct 7-10 a the differences had narrowed somewhat; the Conservatives retained 78% of 2006 supporters, while the Liberals held onto 66%. Another question is how many of the potential supporters will end up voting for the party they support when polled. An Ipsos poll conducted Sep 30 to Oct 2 found, for example, that only 54% of Green Party supporters were 'absolutely certain' to actually vote, compared to figures in the 70's for all the other parties. Volatility and Second Choices The potential for growth in the next few weeks may be more clearly identified by the second choices that poll respondents say they would consider voting for. When asked in a Harris/Decima poll carried out Sep 26-9 found a similar breakdown; those who had a second party choice split 30% NDP, 26% Liberal, 24% Green, 14% Conservative and 9% Bloc. These findings were reinforced in an Ipsos poll conducted Sep 30 to Oct 2, with second choises recorded as: NDP 27%, Liberals 26%, Green 22% and Conservatives 14%. Thus the Conservatives may have a strong lead among first choices, but they have far less room to grow than do the opposition parties. A Nanos Poll conducted Sep 20-22 found that 21% of respondents had changed which party they would vote for since the start of the campaign, and that 18% had switched from a preferred party to undecided. Leaders' Debates The leaders of the five parties with MPs at the time of dissolution held two debates this election, one each in French and English. The French language debate was held on October1. If you missed it, you can watch the French leaders' debate (en francais) in its entirety on-line, thanks to Radio-Canada. An on-line poll by Ipsos found that Dion was the clear winner (42% for dion and 24% for the next leader, Duceppe). However, another poll conducted that same night by CROP found Dion trailing Duceppe by 6 points; see the Globe & Mail report on the French leaders' debate polls. The English debate took place on October 2, with the same format as the French debate. You can watch the entire debate on-line at either the CBC or CTV. Ipsos Reid conducted an on-line poll among viewers of the English leaders' debate and found that although more people (31%) thought Harper won the debate than others, 40% also said their view of Harper had worsened. Note that on-line polls are 'opt-in' and do not have the reliability of a normal poll based on random sampling.
Links to Polling Companies
Other sponsors may be identified in the Canadian election polls linked to in the table of results, above.
|
||||||||||||||||||||||||||||||||||||||||||||||||||||||||||||||||||||||||||||||||||||||||||||||||||||||||||||||||||||||||||||||||||||||||||||||||||||||||||||||||||||||||||||||||||||||||||||||||||||||||||||||||||||||||||||||||||||||||||||||||||||||||||||||||||||||||||||||||||||||||||||||||||||||||||||||||||||||||||||||||||||||||||||||||||||||||||||||||||||||||||||||||||||||||||||||||||||||||||||||||||||||||||||||||||||||||||||||||||||||||||||||||||||||||||||||||||||||||||||||||||||||||||||||||||||||||||||||||||||||||||||||