Results
What did we find out?
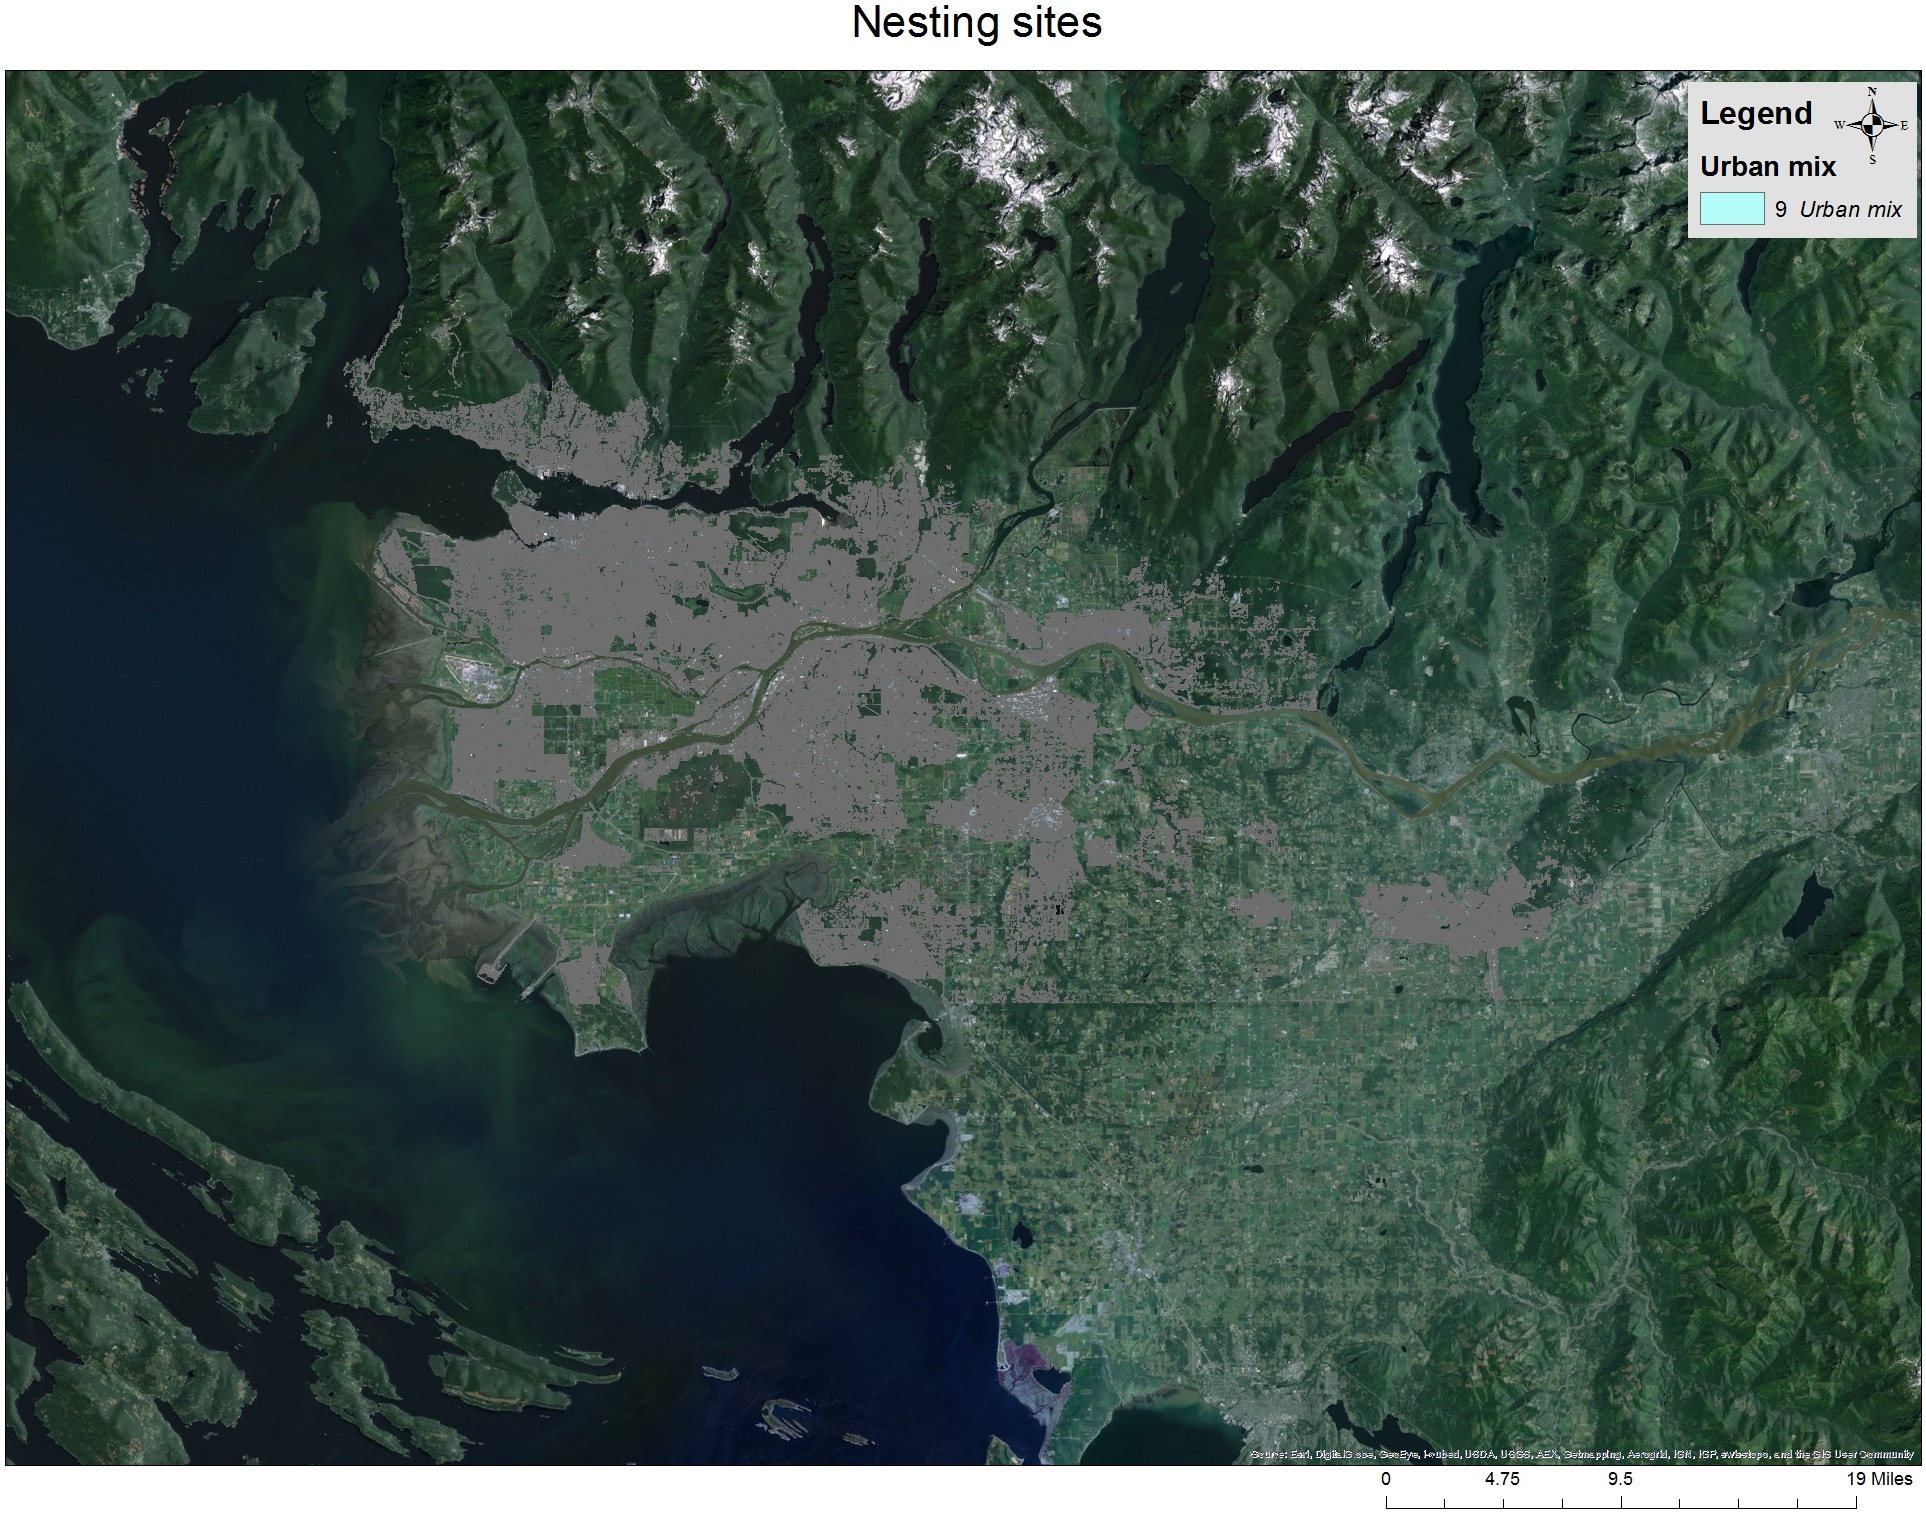
The results of the analysis show a fairly obvious trend in regards to habitat suitability for Barn Swallows. After interpreting where possible nesting locations are via urban mix polygons, the results show that there are a maximum of 295777 possible nesting locations within the Metro Vancouver area. Appendix D shows all possible areas within Vancouver that fall under the land cover classification code of “9” which is classified as urban mix land cover, or single family homes, small buildings and various other structures. The results show that there are possible nesting sites within the entire district, but there certain areas, specifically crop fields and sparsely populated areas, which lack nesting sites.
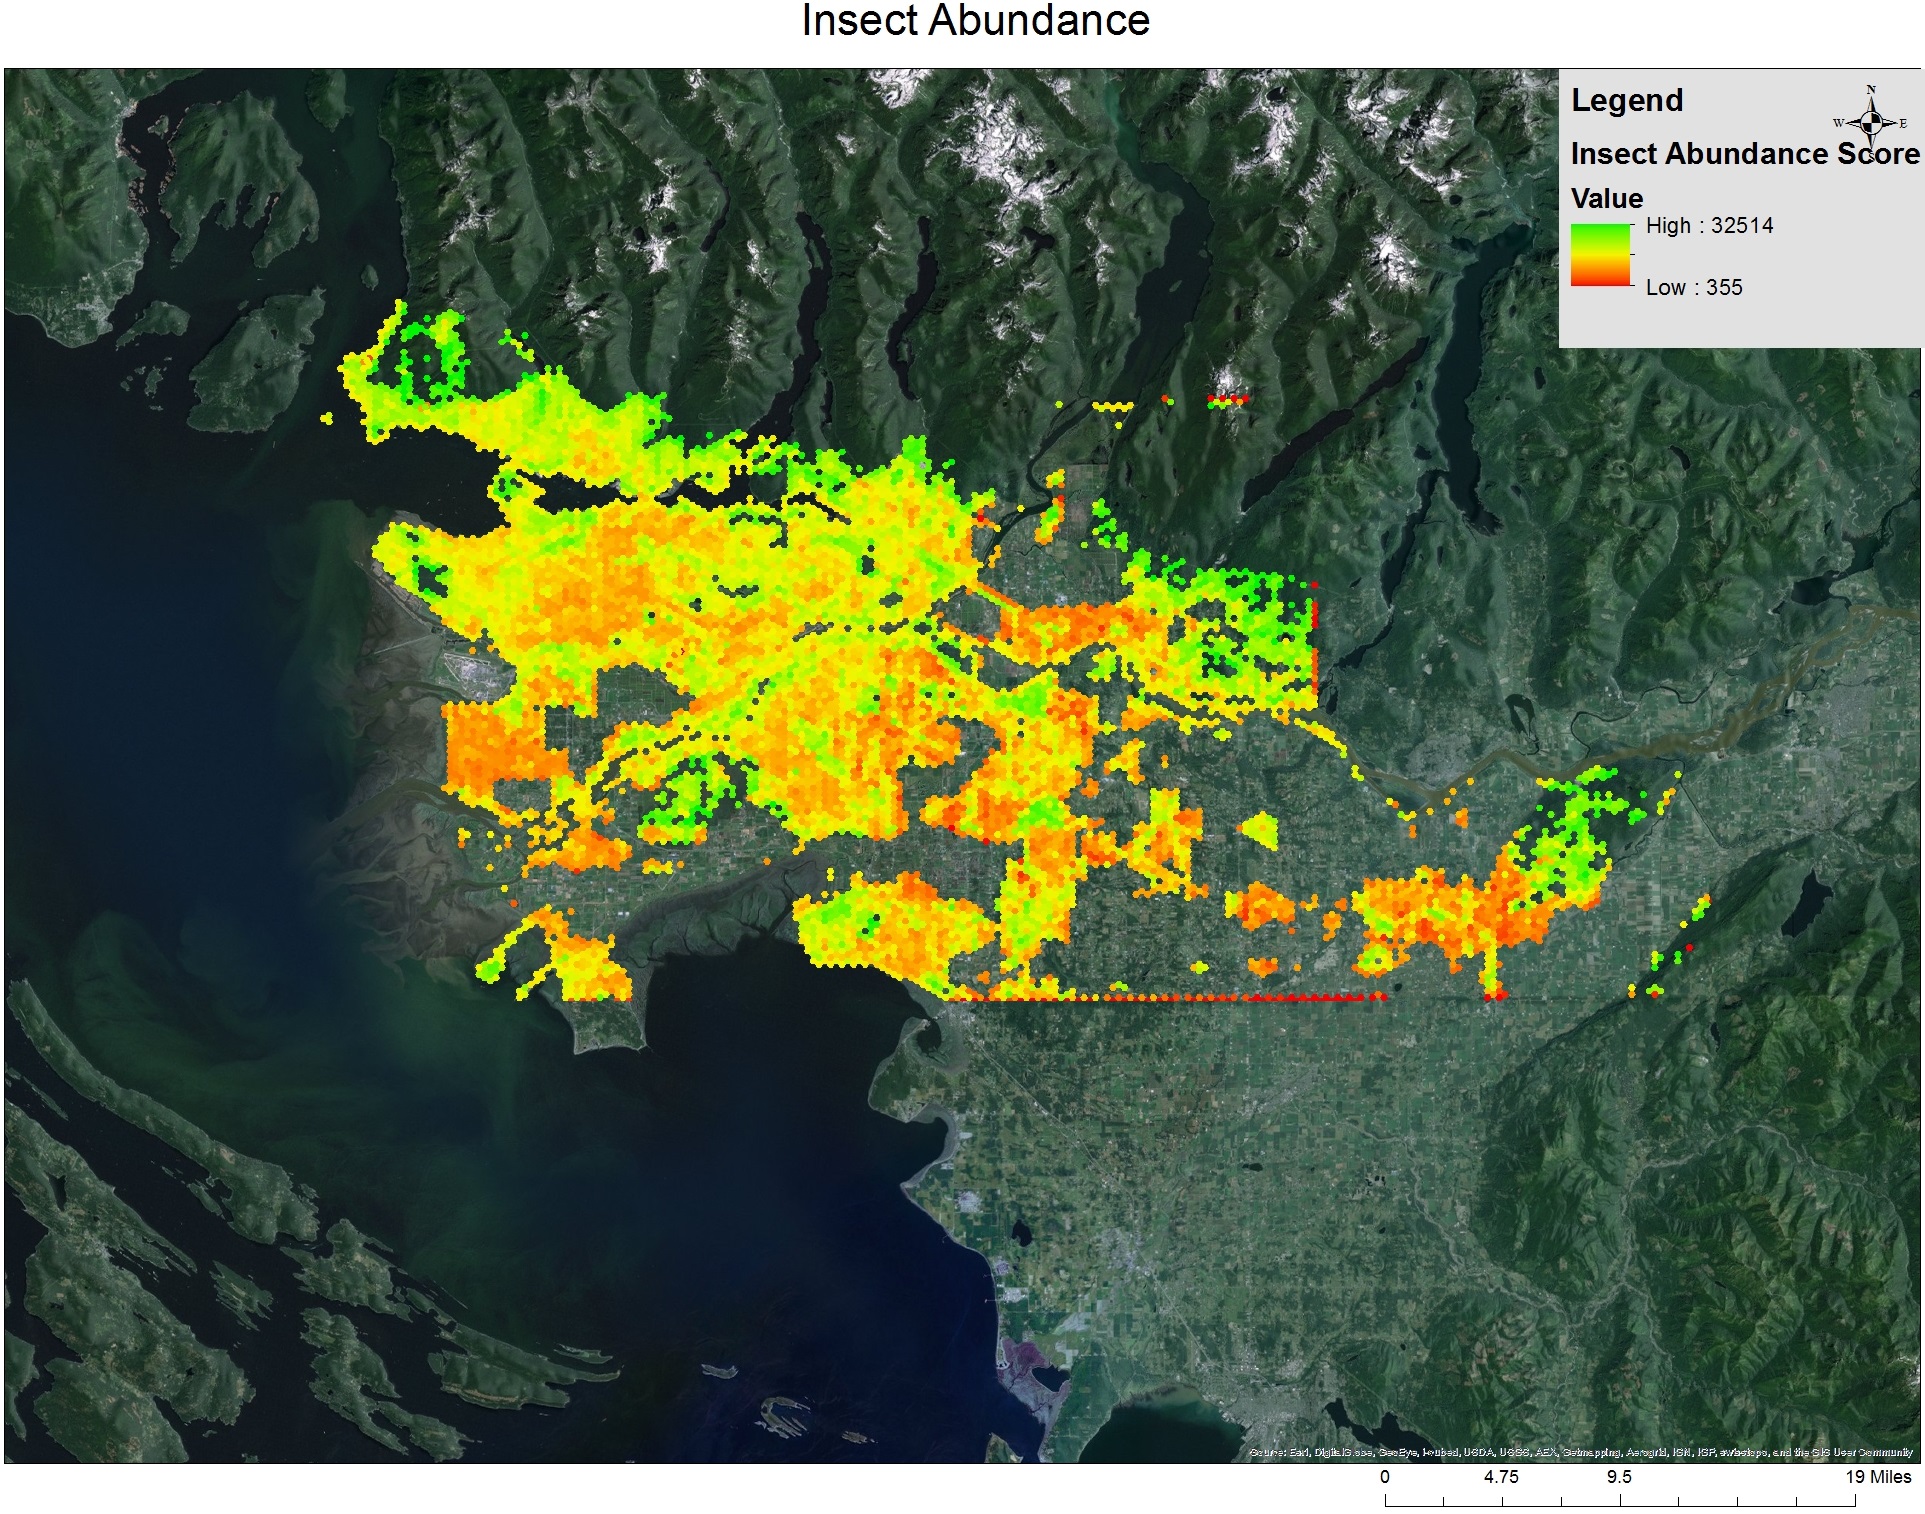
More important than the nesting sites were the results from the insect abundance analysis. This is what would give a much clearer picture of habitat suitability in the region, due to the combination of both nesting sites and the availability of food. The overall predictive abundance of insects from a minimum of 355, which would be very little food in the area for swallows, to a maximum of 32514, which would be an abundant amount of food and therefore a much more suitable habitat (see Appendix E). Given the fact that each of the study areas shown in Appendix E are within 500m of a potential, as per the clients research suggests is the Barn Swallows feeding range, the results show that the most suitable habitats were in sub urban areas or rural areas, whereas city centers, such as Vancouver, were poorly suited due to the lack of food.
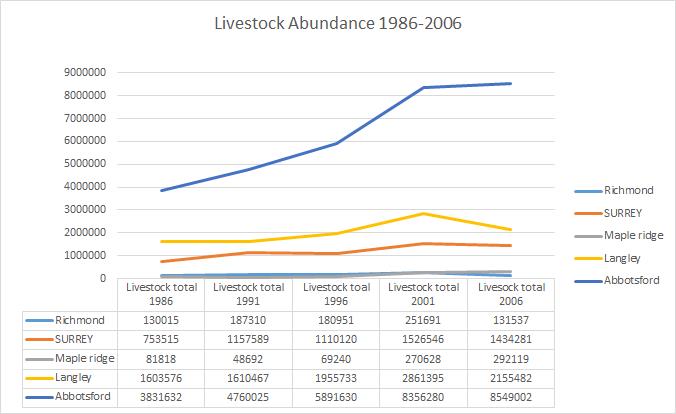
The results from the livestock data shows that the livestock abundance in the Metro Vancouver area is very fluid. For most of the districts, the abundance of livestock shows an increase from 1986 to 2001 and then a decline in 2006. This is true for all the districts except for Abbotsford, which experiences increases from 1986 to 2001 and then simply a slower increase to 2006, with an overall abundance rising from 3831632 in 1986 to 8549002 in 2006 (see Appendix F). On a finer scale, it shows that the increase in livestock is mostly attributed to an increase in chickens in each district, while the abundance of other animal decreases overall.