The
human auditory sensory system, usually referred to as simply
the Ear, is a remarkably complex system that is
usually taken for granted by individuals with unimpaired
hearing. It is the main subject of study by audiology,
usually with an emphasis on speech perception and a variety of
hearing disorders. When we discuss the historical evolution of
these issues below, we will suggest that the modern concept of
"normal hearing" became defined at the point where
hearing ability could be quantified, around 1930, and since
then, audiological measurement has determined what that meant.
An audiologist specializes in the study and treatment
of hearing impairments (and usually has a Master’s degree),
whereas the measurement of hearing ability is termed audiometry
and is practiced by a audiometrist who gives what is generally
called a “hearing test” and can recommend hearing aid
equipment. Due to the rapid evolution of digital hearing
aid technology today and the ongoing development of cochlear
implants, we will leave those topics aside for the time
being.
The branch of medicine that is involved with the ear is called
otology,
and is usually included with otolaryngology, commonly
practiced by an ENT (ear, nose and throat) doctor, who can
also be a surgeon. Note that the prefix "oto" (from the Greek
word for ear) always refers to the auditory system.
These professional branches associated with the subject of
hearing involve a large body of research knowledge,
particularly in comparison with what typical public education
teaches in schools. Here we can only summarize some of the
most relevant terminology and issues that are involved.
A) Anatomy of the ear
B) Auditory analysis in the inner ear
C) Hearing loss and impairment
D) Damage-risk criteria
Q) Review Quiz
home
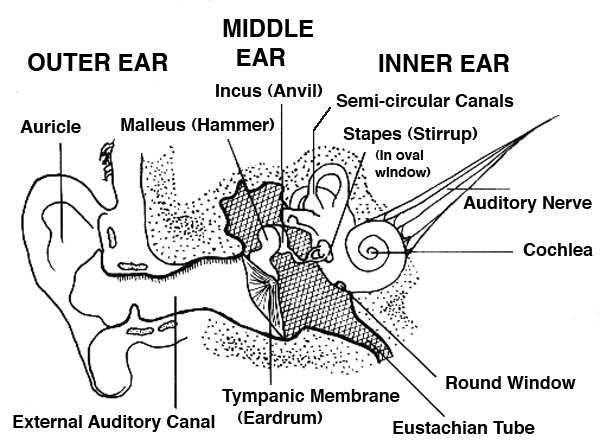
A. Anatomy of the ear. The
anatomy of the ear is commonly divided into three parts, the
outer, middle and inner ear as shown in this diagram.
The outer ear consists of the auricle, which funnels
sound waves into the ear canal, a process that we described
earlier as kind of impedance
matching operation since acoustic energy does not
easily pass from open air to a small “tube”. Also when we
discussed binaural
hearing, we pointed out that the ridges of the
outer part of the ear, called the pinna (Latin for
"wing" with the plural being pinnae), create
small delayed versions of the sound wave. When combined with
the direct sound, these delays colour the spectrum above 8
kHz and provide us with directional cues for front-back
distinctions, as well as elevation. The auricle and pinna
are different for each individual, and can change throughout
one's lifespan.
The slightly curved ear canal (or “external auditory
canal”), as with any small enclosed space, provides a high
frequency resonant boost, as will be shown below. It ends at
the eardrum (or tympanic membrane) where the
pressure variations in the auditory canal cause it to
vibrate.
Care needs to be taken not to allow a wax
buildup in the ear canal, and sharp objects have to be
avoided. Even using a Q-tip is not recommended, and may
simply push the earwax (also called cerumen) deeper
where it can become impacted. A healthcare provider may
recommend liquid drops or perform an irrigation of the ear
canal with water, or a dry microsuction.
Foam earplugs are designed to be flexible enough to
fit into the ear canal, but custom-designed earplugs made
from other materials (preferably with flat frequency
response) can also be purchased. Noise-cancelling headphones
are now often used by the public, the principle of which is
described in the Sound-Sound
Interaction module. These types of protectors are
called ear defenders, and in the best cases, they
can reduce sound levels by 30-35 dB.
The pressure on either side of the eardrum is assumed to be
equal, but when the external atmospheric pressure changes
(as with elevation), there can be an imbalance in
pressure, most easily relieved by yawning (or
“popping” one’s ears). As you can see from the diagram, the
Eustachian tube leading to the lungs is what allows
that to happen. However, there is also a danger of infection
in this closed region beyond the eardrum, particularly with
high fever (childhood) illnesses such as German measles and
meningitis that can cause serious and even permanent damage
to hearing.
Autophony refers to hearing one's
own voice too loudly through the occlusion of the ear canal
by earwax or other blockage (similar to wearing earplugs).
It can also be caused by otitis media in the middle
ear (described below), or a disorder in the Eustachian tube
(Patulous Eustachian Tube) where it is sometimes open
and allows internal sounds to be conducted to the middle
ear.
The movement of the eardrum at the threshold of hearing is
said to be so small that it cannot be seen with the naked
eye as the distance is less than a wavelength of light. And
if it were any more sensitive, molecular movement could
heard! Given that it can also withstand pressure that is a
million times stronger (admittedly with discomfort) this
represents a remarkable dynamic range. However, very large
pressure transients can perforate or burst an eardrum,
though in some cases this can be surgically repaired.
The middle ear consists of three
very small bones (the smallest in the body) called the ossicles.
Their function is to transfer the energy from the eardrum's
response to changes in air pressure through these solid
bones as a kind of amplification (up to 22 times their
original amplitude) and deliver it to the inner ear. The
bones are commonly called the hammer, anvil
and stirrup because of their shapes, but their
proper names are the malleus, incus and stapes,
respectively.
In the above diagram, the very small stapedius muscle
(about 1 mm in length) which is attached to the stirrup, is
not shown, but its function is to damp a large
incoming pressure surge (greater than 85 dB) as a form of
hearing protection. However, for the brain to detect such an
increase and send a message to this muscle to contract
requires a time lag estimated at up to 300 ms. Unfortunately
this mechanism cannot react quickly enough to protect
against impact sounds with very fast attacks,
particularly gunfire, but also some other mechanized sounds,
in which case hearing protection must always be used.
The stapedius muscle can also be activated by one's own
speaking voice in order to prevent its low frequency
components (that become obvious with earplugs) masking other
incoming sounds.
Inflammation of the middle ear is called otitis media
and can be very painful and often affects young children.
As mentioned above, both the unimpaired
outer and inner ear have their own resonant frequencies, as
shown here, both in the range of 1-4 kHz. Together they give
a 10-20 dB boost to those frequencies prior to entering the
cochlea. This explains why the frequency response of the
ear, as shown in the Equal
Loudness Contours, is always higher in the 1-4
kHz range, at all intensity levels.
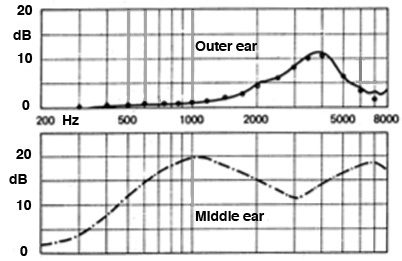
Frequency
response of outer and middle ear (source: Brüel)
The last bone in the ossicular chain is
the stapes, or stirrup (less than the size of your
smallest fingernail), and it acts like a piston at the oval
window of the cochlea (see the first diagram),
transmitting the vibration to the fluid inside. This wave
passes through the spiral-shaped cochlea as
described in the next section, with the round window
at the far end responding to the pressure that it exerts. A
small wave called otoacoustic emissions can be
emitted from the oval window and pass back through the
middle ear and out the ear canal where they can be picked up
by a microphone. They are a sign that the cochlea is
functioning properly.
Any impairment in the energy transmission through the outer
and inner ear results in conductive hearing loss,
which can be a mechanical issue caused by calcification of
the bones that can be corrected by micro-surgery, or by a
tumour. This transmission through the ossicles should not be
confused with bone conduction, which refers to sound
passing through the bones of the body and reaching the
cochlea (which is embedded deep within the bones of the
skull) as discussed next.
The inner ear consists of the
snail-shell-shaped cochlea
(cochlea is Greek for snail), the three semi-circular
canals and the auditory nerve passing to and
from the brain. Whereas the sound wave changes media from
the air, through the bones of the ossicles, and then to the
liquid filled cochlea, it is the analysis of the
wave inside the cochlea that is crucial – and the most
complex part of the system – so we will devote the next
section to understanding how it works.
However, before we do that, it is worth noting the function
of the three semi-circular canals, named for their horseshoe
shape, that are part of the bony labyrinth of the cochlea.
They are our balance mechanism, each of the three
responding to movement in the x, y and z planes, that is,
the three dimensions of possible head movement.
The three canals are filled with endolymph, similar
to the cochlea, which responds to movement and acceleration
by bending the cilia of the hair cells, also similar
to the cochlea. The horizontal canal detects motion
when we turn our head left and right, around a vertical
axis. The superior canal does the same for nodding
the head around the lateral axis, and the posterior
canal reacts to a movement of the head towards the shoulder.
In other contexts such as flying, these movements are called
pitch, roll and yaw. It is important to keep in mind that hearing
and the sense of balance are intimately connected.
Index
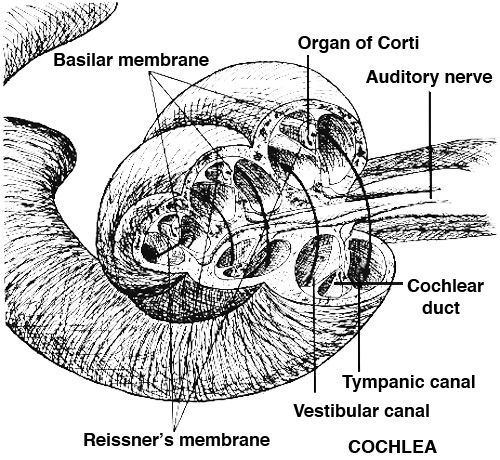
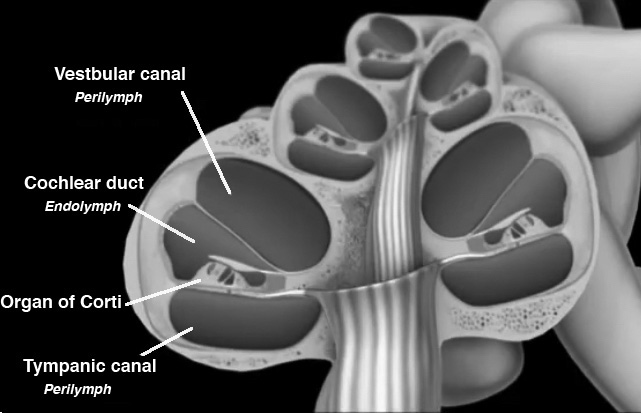
B. Auditory analysis in the inner ear.
The interior structure of the bony cochlea is tricky to
understand because it includes a canal filled with perilymph
(a fluid similar to plasma and cerebrospinal fluid, rich
in sodium and poor in potassium). This canal is called the
vestibular canal (scala vestibuli), that
starts at the base of the cochlea and the oval window
where the stapes is creating a pressure wave. This canal
ascends to the apex of the cochlea, spiralling around
2-1/2 times, and then the wave returns down a second
canal, the tympanic canal (scala tympani),
back to the basal end where the round window is located to
relieve the pressure.
In between the two canals is the cochlear duct (scala
media), filled with endolymph (a unique kind
of fluid rich in potassium and low in sodium, the opposite
of the perilymph), within which resides the organ
of Corti which is attached to the basilar
membrane that separates it from the tympanic canal.
A similar membrane called Reissner’s membrane,
separates the cochlear duct on the other side, from the
vestibular canal. Given the spiral shape of these canals,
it is difficult to visualize them, but we will try to do
this with two cross-sectional diagrams. You can also look
for some of the digital animations of the cochlear
structure that are available online.
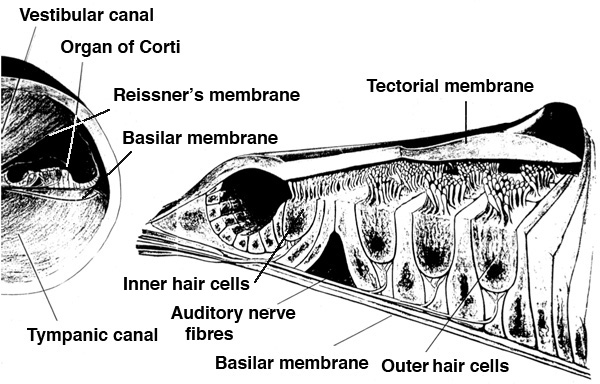
The organ of Corti was discovered
by an Italian anatomist, Alfonso Giacomo Gaspard Corti in
1851. However, the hair cells attached to it cannot be
seen in visible light with a microscope, and so it
remained until the advent of the electron microscope
to make these features visible. In the next diagrams, we
can see more of the placement and structure of the organ
of Corti on the basilar membrane, including the three rows
of outer hair cells, and one row of inner hair
cells, all of which can fire in response to the
incoming sound wave and send those impulses via the
auditory nerve to the brain.
As you can see, the organ of Corti will move in response
to the fluid wave that affects the basilar membrane, on
its way down the tympanic canal. However, the hair cells
are not in contact with that membrane (which would likely
result in some damage over time). Instead, they have
contact with the tectorial membrane above the
cells, which is protected from the two canals and the
motion of the fluid wave.
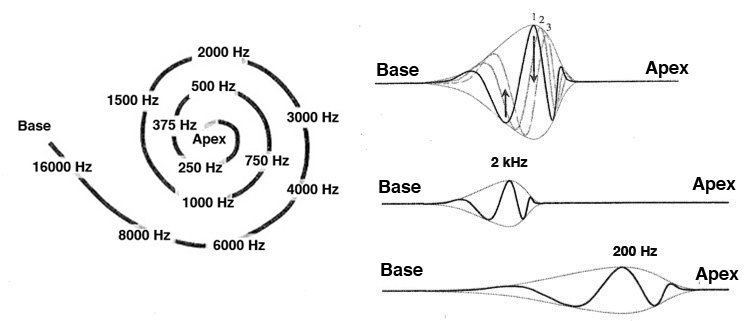
As we have discussed previously in terms
of the spectral analysis along the length of the
basilar membrane – often referred to as a “bulging” of the
membrane, but better understood as an oscillatory motion
shown below at the right – there is what is called a tonotopic
mapping of the frequency response along the basilar
membrane according to position along its length. If the
membrane were uncoiled, its length would be 33-34 mm
– incredibly small – with the position of resonance going
from high frequencies at the basal end to low frequencies
at the apical end, as shown.
Notice that the high frequencies are analyzed near the
base where the basilar membrane is the stiffest (thereby
allowing only high frequencies to resonate), with 4 Khz at
the first “turn” of the spiral. It is thought that the
mechanics of the fluid vibration in this area might
contribute an answer to the naive question: why do we lose
high frequency sensitivity with age, and not low?” There
are, of course, many factors involved in hearing loss that
we will look at in the next section, but it is useful to
keep this in mind.
The more important aspect of this
spatial arrangement is that the resonances at octave
intervals are equally spaced along this length, as
shown here. This gives rise to the logarithmic
scaling of frequency that we associate with cochlear
analysis. This diagram shows the octaves of the pitch A,
which double in frequency, as resonating at equal
distances from the base of the cochlea.
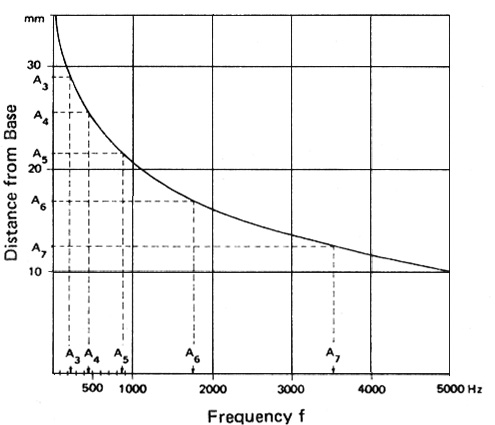
Frequency
distribution along the length of the basilar membrane
showing its logarithmic basis
When stimulated with a periodic sound,
the hair cells will fire at the same rate as the
periodicity, as long as it’s in the low to mid range where
there is time for them to regenerate. This ability results
in our fine-tuned sensitivity to pitch in those ranges.
Above that, groups of nearby hair cells will fire together
at the same cumulative periodicity, called volley
theory.
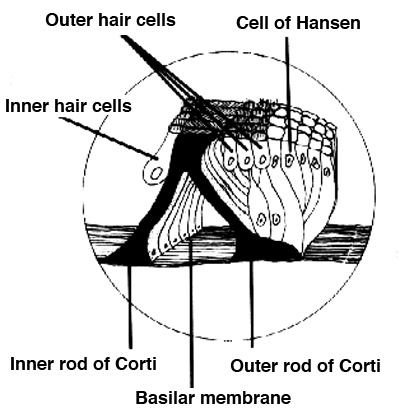
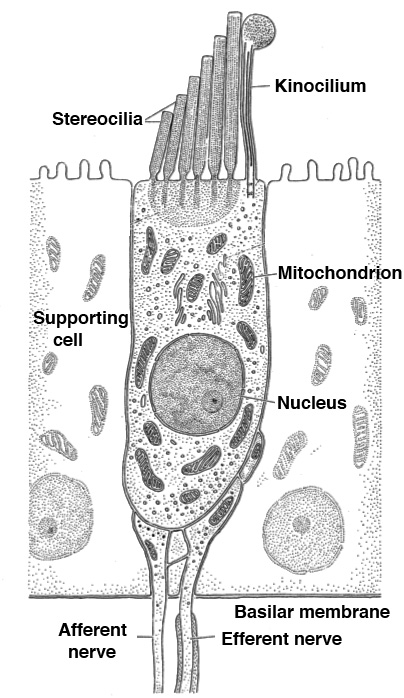
We are now ready to examine the hair
cells themselves. A healthy ear has over 15,000 such
microscopic fibres, which are actually bundles of fibres
called stereocilia, plus a singular one called a kinocilium.
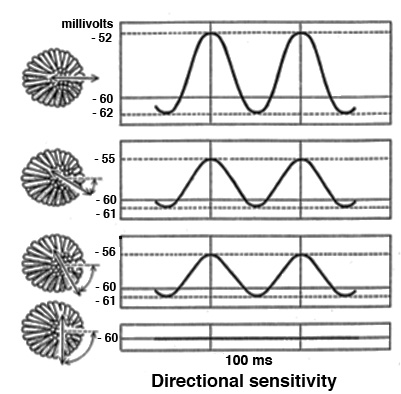
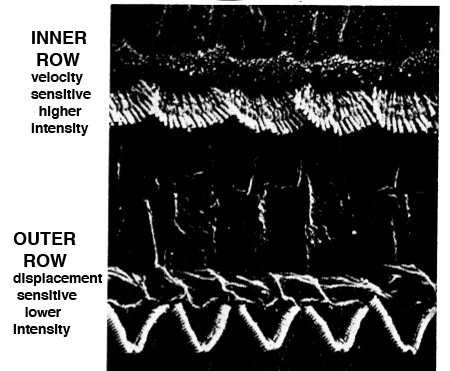
There are three outer rows of hair cells in a
V-shaped formation. They respond to lower intensity
sounds by being displacement sensitive. They
are shown at the bottom in an electron microscope photo at
the right. Above that is a diagram that shows what
“displacement sensitive” means in terms of directionality
– a full amplitude range signal is produced when the
displacement is to the right, as in the top diagram, and
zero amplitude when it is 90° away from that direction,
with a proportional diminution in between.
The function of these outer hair cells
(found only in mammals) is to amplify quiet sounds,
such that a wider dynamic range of amplitudes can be
accommodated by a smaller range of hair cell deflections,
a process called cochlear amplification. They also
improve frequency discrimination which is very
important in speech and music. A chemical reaction here
also allows cells to adapt
to constant level sounds, since the brain is always alert
to new information coming in. On the other hand, the outer
hair cells are unfortunately also the first to be damaged
by noise, as discussed later.
In contrast, the single inner row of hair cells
responds to higher intensity levels, and their
stimulation is velocity sensitive.
You have probably thought of the hair cells as only
sending impulses to the brain along the auditory
nerve. This “ascending” pathway is referred to as “afferent”
and is well understood. However, the hair cells also receive
impulses from the brain along the “descending” pathway,
referred to as “efferent”.
These efferent stimulations are less well understood, but
in general they influence the behaviour of the hair cells
in terms of their response, such as in noisy contexts. The
ability to detect signals in a noisy environment is well
known to decline with age, for instance. They can also
modulate cochlear amplification in the outer hair cells,
mediate selective attention, and create an improvement of
the signal to noise ratio. This also allows them to
support adaptation
and frequency selectivity, which shows that the auditory
system is a dynamically functioning system, not
merely a passive signal processor.
Index
C. Hearing loss and impairment.
Instances of hearing impairment have certainly occurred
throughout history, but it began to be regarded as a
serious medical and social problem in the 19th century
as a result of industrialization. In fact, one of the
early terms for hearing
loss was boilermaker’s
disease, because of the high sound levels
involved. However, many industries, particularly in
Scotland and the industrial north of England were known
to produce serious degrees of hearing loss, as in the
well documented case of the female jute weavers that
will be discussed shortly.
Although noise has been and remains a significant cause
of hearing loss (referred to as NIHL,
Noise-induced Hearing Loss), there are many other causes
and types of degradation of the auditory function, such
that it is regarded as a worldwide problem, estimated as
affecting over a billion people in various degrees. We
will start by giving a brief summary of the major types
of hearing loss, and associated issues.
These conditions should be kept separate from deafness
(or anacusis) which is a complete lack of
hearing ability, with an associated community who have
established their own forms of communication such as
sign language. The "hard of hearing", on the
other hand, are those who use a mix of lipreading and
hearing aids.
We will provide brief definitions
first, and then discuss some of these categories and
conditions more fully. Note that all of them can be
unilateral (a single ear) or bilateral (both ears),
asymmetrical (affecting each ear differently), and
experienced in combination.
- acoustic
trauma refers to a sudden and severe sensorineural loss
of hearing (over 40 dB loss), often incurred by a single
exposure to high sound levels, for instance from an
explosion or gunfire, or very high levels over an
extended period; the aftermath of the trauma can include
ringing in the ears (tinnitus), balancing problems, and
hyperacusis,
a painful sensitivity to certain frequencies or sound levels
which often affects musicians (and may accompany other
diseases)
- conductive
hearing loss, as referred to above in terms of the
transfer of acoustic energy through the outer and inner
ear; the causes are quite varied but often can be
treated
- sensory-neural
(or sensorineural) hearing loss, which refers to a
gradual reduction of hearing sensitivity in the cochlea
through damage to the hair cells; it can be temporary
(that is, recoverable with rest and quiet), chronic or
permanent, and is measured with an audiogram, as
shown below; it can also be sudden as described above as
acoustic trauma, and can be combined with conductive
loss
- central
hearing
loss, which refers to an impairment resulting from
defects in the central nervous system, including the
auditory cortex, rather than the middle or inner ear; it
can be caused by lesions in the auditory pathway or
cortex such that sounds are heard but not understood
- presbycusis
is age-related hearing loss, always in the high
frequencies, and has many contributing factors, as
discussed below
- tinnitus
refers to a persistent sound in the ears when there is
no external source; it can be a byproduct of ototoxic
chemical exposure or excessive noise, or it can be an
indicator of other medical problems
- recruitment
is a non-linear amplification of sounds where normal
level sounds are heard as much quieter, but above a
certain point, they are heard as much louder, and
therefore they can mask other sounds and create
sensory-neural hearing loss; the non-linear gain
with this condition is similar to hyperacusis,
mentioned above
- diplacusis
is a loss of frequency sensitivity in one ear that
results in pitch being heard differently in each ear,
sometimes called double hearing or interaural pitch
difference; based on an appreciable delay between the
ears, it can also affect rhythm perception
The sources of hearing loss are often
divided as follows:
- occupational
hearing
loss is associated with workplace exposure
to noise, for which most industrialized countries have
established damage
risk
criteria (discussed below) and other regulations
- sociocusis
is non-occupational hearing loss, and thus harder to
regulate; it also makes it more difficult to adjudicate
occupational claims for compensation because the
measurement of hearing loss cannot distinguish which
sources are its cause
Sensory-neural hearing loss. A
standard hearing test – which is now usually offered free
of charge at most audiology clinics – includes a pure-tone
audiometric test and a speech-in-noise test, given to each
ear separately since their sensitivity can be quite
different. In fact, bilateral differences are quite
common.
It may also involve other tests, such as with a typanometer
that sends a puff of air to the eardrum to measure its
responsiveness, to test if there is any conductive hearing
loss. Other tests may involve the cochlear response.
The results of the pure tone tests (i.e. sine
waves) for frequencies, usually between 250 Hz and 8 kHz
(known as the speech range), are displayed on a graph
called an audiogram.
Note that the threshold of hearing level is at the top on
the 0 dB line. This line has been flattened out to account
for the threshold of hearing being variable at all
frequencies, as shown on the Equal
Loudness Contours.
The vertical axis is called the Hearing Level in positive
dB increments (which is referred to as dB HL), and
indicates the signal level above the threshold
that the subject has been able to just detect. Values for
the left and right ears are plotted separately, and
together they show the frequency response of the
ear.
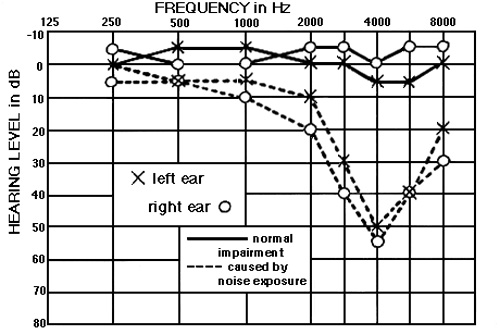
An audiogram
showing the typical notch at 4 kHz associated with noise-induced hearing loss
Values above the 0 dB hearing line are possible for
unimpaired hearing, either because of the standard deviation
of the measurement (+ or - 5 dB) and the fact that when the
test is being done, it may be difficult to determine which
is the faintest sound that can be heard (with multiple
exposures being required and an average taken of correct
responses).
Low frequencies below 250 Hz are not
usually measured because there is seldom any hearing loss
(HL) in that region, and those frequencies are not important
for speech. Likewise there is no test above 8 kHz where the
amount of presbycusis could be detected, again
because of a bias towards the speech frequencies, ignoring
their role in music, and environmental sound localization.
In fact, until recently, audiologists have only focussed on
speech perception and therapeutic interventions aimed at its
improvement.
One advantage of the graphic format of an audiogram is that
it shows hearing loss as a vertical decline
(compared with other graphs we will present below), and
therefore the results are communicated more intuitively.
"Normal" hearing is regarded as the range from -10 dB to +15
dB HL, with the range of 16 - 25 dB being a slight loss. A
hearing loss of 25-40 dB is regarded as “mild”, 40-60 dB as
“moderate”, even though this degree of loss will create
serious problems in communication, and below that, “severe”
and “profound” loss, the latter being deafness. The complete
scale is shown here.
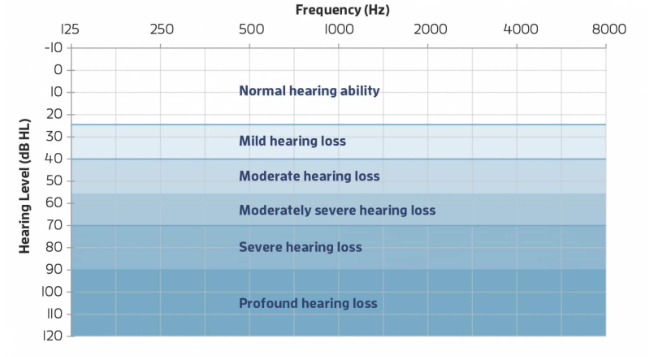
Degrees of hearing loss shown in dB HL (Source:
healthyhearing.com)
Another important role of the audiogram
with NIHL (noise-induced hearing loss) is that it
clearly indicates the effects of noise exposure, which are
quite distinct from presbycusis (age-related HL). The old
excuse that HL is just because of age, and not noise exposure,
is untenable. NIHL occurs with a characteristic notch at 4
kHz, as shown above, and typically deepens on the lower
side over time. As we have repeatedly seen throughout the
Tutorial, this is the frequency range that is most important
for speech and other
essential aspects of acoustic communication, particularly
because it incorporates both vowel and consonant information.
Here is a sound example where we implement the same severe
loss shown in this particular audiogram shown above. Note how
muffled and ambiguous the speech is, even on headphones. If
significant background noise were present, the intelligibility
would be even less, as dicussed below.
Voice
heard without and with the hearing loss shown in the
audiogram above (Source: Sylvi macCormac)
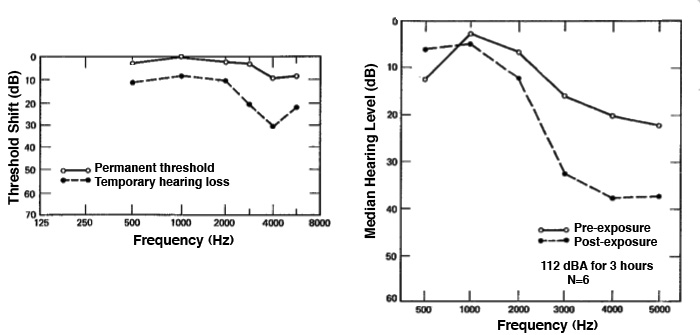
Temporary Threshold Shift (TTS) shows
the same notch pattern in an audiogram, as in the diagram
below, on the left for workers at the start and end of a
shift, and at right for a rock band rehearsing or performing
for three hours at a very dangerous level of 112 dBA. In fact,
as discussed below under Damage-Risk Criteria,
any exposure above 90-95 dBA for this length of time is
regarded as having a high risk of permanent hearing loss.
TTS is the result of the outer hair cells (those
that respond to lower levels of sound) becoming saturated
and are no longer firing. They are also deprived of a
nutrient supply of blood via the very tiny capillaries that
service them. One effect of noise, as we will see in the
next module, is an increase of blood pressure and decrease
in blood flow to the “extremities” which normally means the
hands and feet, but it can also affect the hair cells and
the semicircular canals for balance.
It should also be noted that, whereas TTS as a formal
definition refers to noise exposure, there are other
conditions, such as even the common cold or earwax buildup,
that can reduce hearing acuity on a temporary basis. As
discussed in the Magnitude
module, hearing is constantly adapting to the ambient
sound level, such that our impressions of loudness are relative,
not absolute. We are generally unaware of these shifts,
unless we go from a relatively high to low ambient
situation, or vice versa.
The key difference is that TTS puts the emphasis on a change
that may become permanent, unlike this continuous change in
hearing sensitivity that we experience every day.
19.
Personal Listening Experiment. Buy a
pair of foam earplugs at a drugstore (they are good to
have on hand), make sure they are fitting snugly in
your ears and are comfortable. Leave them in for at
least a half hour, or longer if possible, as you go
about some daily walking activities (but not driving
or biking). What sounds become magnified, and which
sounds that you normally expect become muted or
absent? When you eventually remove the plugs, you will
have a threshold shift where everything will sound
louder than normal. Estimate how long it takes to
adapt to the ambient level where you are. The effects
you experience are based in the occlusion
(blocking) of the ear canal, and increased awareness
of bone
conduction.
Sometimes
audiologists and others, trying to explain TTS, use a
comparison to trampled grass which can “recover” if not
walked on further. Admittedly, the stereocilia of the
hair cells might be comparable to grass, but the cause
of TTS is not a physical one of being crushed.
Overstimulation and a lack of blood supply is a better
explanation.
Another side-effect of more severe
noise exposure is a ringing in the ears, called
tinnitus, which is caused by the hair cells
firing spontaneously after the overstimulation.
This should in fact be an “early warning signal” that
over-exposure has occurred and future exposure should be
avoided. It can also occur as a side-effect of, most
commonly, aspirin and similar pain management drugs
which also constrict the blood vessels and reduce flow
to the hair cells. However, there are many other causes
of tinnitus as noted below.
If there is insufficient time for recovery, TTS can
become chronic, and eventually a permanent
threshold shift (PTS). If this is the result of
noise it is called NIPTS (Noise-induced
Permanent Threshold Shift). PTS and NIPTS mean that some
of the hair cells are dead and, as is typical in mammals
(but not fish or birds), they cannot be regenerated.

These graphs, generated from lab experiments, show that
there will be approximately a 25 dB TTS after an hour’s
exposure to a 4 kHz noise at 90 dB, and the shift will be
in the range of possible acoustic trauma (leading to PTS)
after 8 hours. The righthand diagram shows recovery
times for a full 7 days of exposure which will lead
to PTS. However, the dotted line shows that a 95 dB
exposure for just under 2 hours will require a full day
for recovery. This indicates how noise exposure can become
chronic if there is not at least 16 hours of non-exposure,
and result in permanent loss of course with higher levels.
The Jute Weavers. The long-term
effect of NIPTS, as to how it keeps worsening, has been
well established since the original publication in 1965
of the case of the “jute weavers” and their audiograms.
What has not always made clear, is that these were all
women who had worked in the mills of Scotland for
anywhere from 1 to 40 years in a constant, high
intensity level factory setting measured at around 100
dB, without hearing protection.
The sad truth about their existence is only mitigated by
the contribution the knowledge of their plight has
served for audiology. The clarity of the data was
supported by the fact that these women had little or no
exposure to gunfire, or other high level noise other
than their workplace. And most had never worked anywhere
else, so the cause and effect paradigm was near
“perfect”.
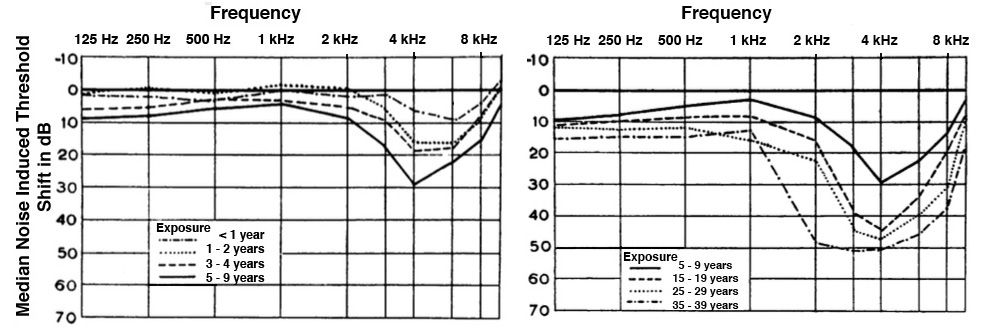 Audiograms
for the jute weavers after multi-year noise exposure
Audiograms
for the jute weavers after multi-year noise exposure
The curves from top to bottom, then left to right, show
that the sensory-neural HL in the
first 10 years keeps growing around the 4 kHz notch, but
after that, it starts digging more deeply into the 1-3
kHz range – all of which are important speech
frequencies. The old excuse not to wear hearing
protection in older workers (because their hearing was
already gone) is not valid.
The data also suggests why the
relatively slow but steady deterioration can lead to
denial and some forms of adaptation by the worker’s
family and friends. Lipreading will likely be
practiced more, friends and family may learn to “speak
up” (even though it’s clarity, not loudness that
matters), but in the end there is greater social
isolation.
Most of us have no experience, luckily, of working in
such a high intensity industrial situation, and in
developed Western countries such conditions would not be
allowed without hearing protection. But in the rest of
world, there are usually few such measures being
enforced. Here is a recording made in a German textile
manufacturing factory of a room with 100 weaving
machines whose output was measured at 100 dBA, similar
to that of the jute weavers. This excerpt only lasts a
minute, but if you have a Sound Level Meter and turn up
the volume to even 90 dB you can experience how
intolerable the loudness of the sound is. Ironically,
since the recordist was moving about the room, it has
been commented on that the rhythms of the machine are
aurally interesting.
100
weaving machines at 100 dB, Kolb & Schüle
textile factory, Bissingen, Germany
Source: WSP Eur 17 take 9
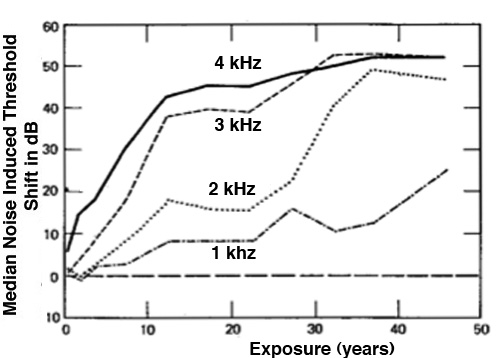
This next diagram is a graph that shows more or less the
same data, but in a reverse format in terms of the
“growth” of the hearing loss, which is less intuitive
but still quite telling. It shows that the 3 and 4 kHz
loss occurs fairly quickly over the first 10 years, and
after that, there is still steady growth at 1 and 2 kHz.
Lastly, we should clarify another
myth about sensory-neural hearing loss. Speaking more
loudly to someone with this kind of impairment is not
the right thing to do (and certainly no one likes be
shouted at). It is better to (1) face the person and
allow them to lipread, once you have their
attention, and (2) to speak more clearly and
enunciate words properly.
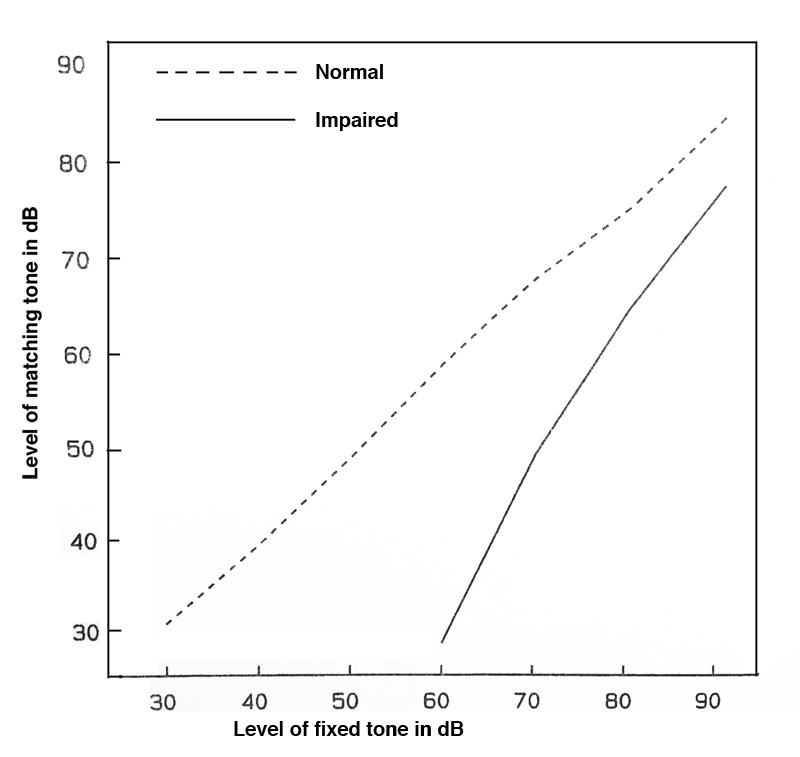
The other implication of this kind of HL is that the
person will avoid noisy situations because they are
less able to pick out conversation and other sounds
from the background din. Over time, this tendency
promotes social isolation. We can try to understand
the reason for both of these situations with the
following graphs that shows how impaired hearing (in
different subjects) differs from normal hearing in the
frequency resolution of the ear.
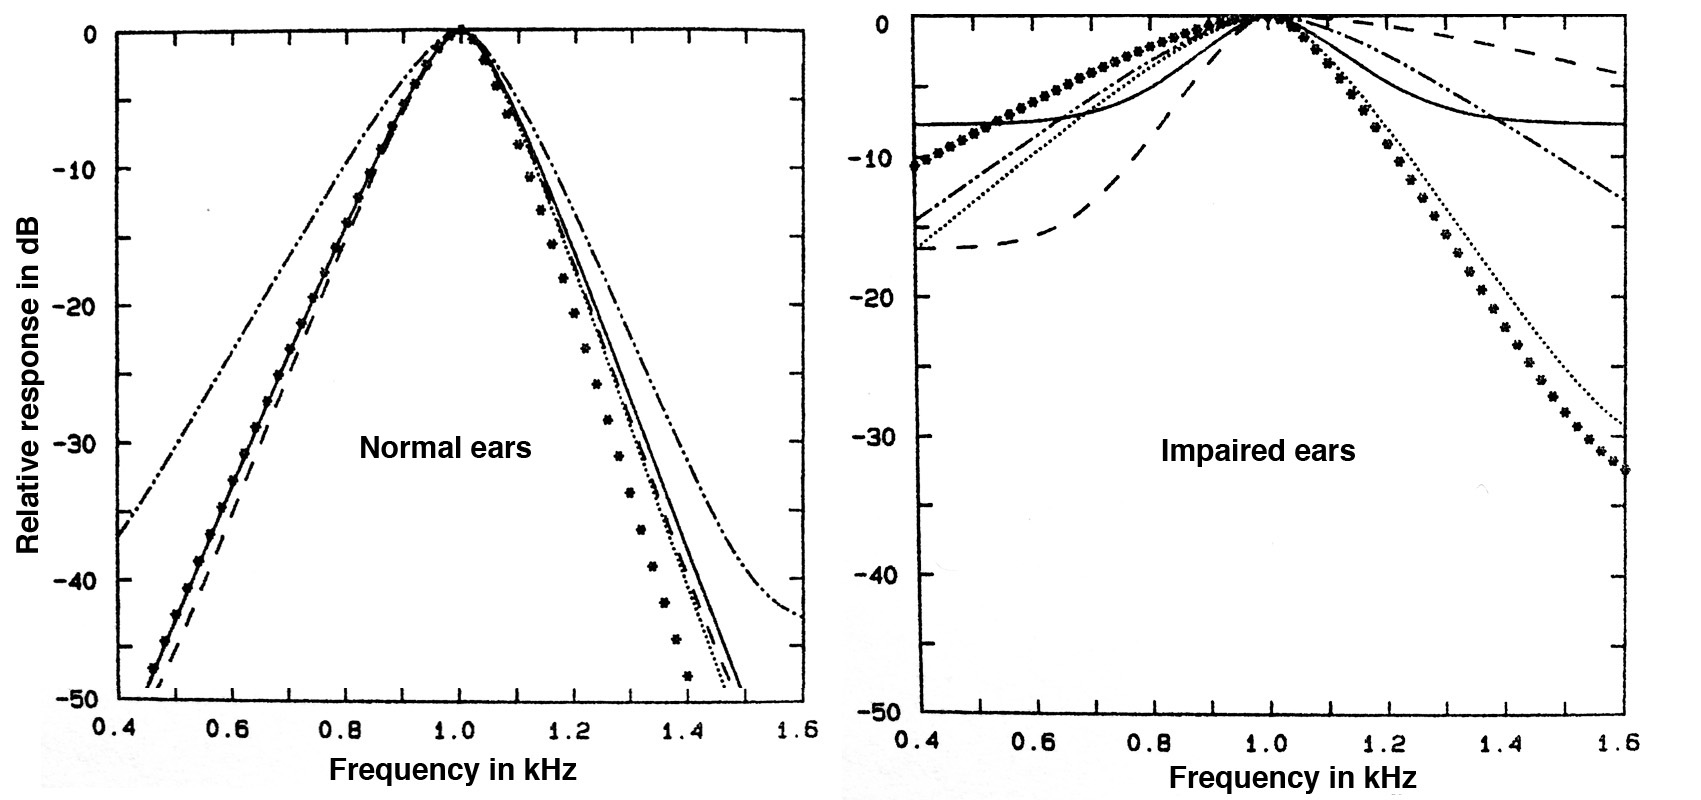 Frequency
resolution in normal and impaired ears at 1 kHz
Frequency
resolution in normal and impaired ears at 1 kHz
The “normal” graphs for the 1 kHz centre frequency are
sharp and well defined. Therefore, information in
adjacent bands, and across the frequency spectrum, are
more detailed via the distribution of resonances along
the basilar membrane in the cochlea. For impaired
ears, the filter bands are much broader and even less
well defined for lower frequencies below the centre.
Hearing with this type of reduced sensitivity would be
like seeing through a blurry window - nothing would be
well defined, and distinguishing a sound in the
presence of noise would be degraded.
Presbycusis. The
deterioration of hearing with age is called Age-related
Hearing Impairment (ARHI), but it is also known
as presbycucis
and regarded as a non-occupational type of
loss. It normally takes the form of a roll-off of
high frequencies above 8 kHz, similar to a low-pass
filter, with higher frequencies attenuated
first, then progressively lower ones with age. As we
saw with the audiogram above, the very high
frequencies are not normally measured in a standard
hearing test, as they do not directly affect speech
comprehension. Speech and music with such a high
frequency roll-off merely sounds duller.
However, these diagrams show a typical presbycusis
loss in men and women for the critical speech
frequencies of 1-4 kHz, according to age. The loss is
always greater for men than women? Why would you
suppose that to be true?
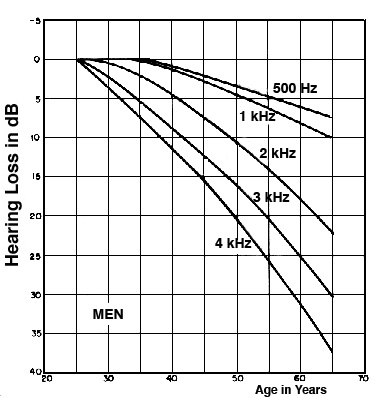
|
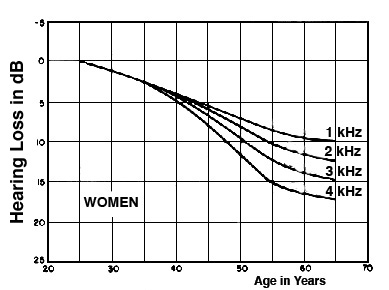
Typical presbycusis curves for
men and women
in the most critical speech frequency
range
|
If you answered the above question by thinking that
men would be more likely to be exposed to noise in
the workplace, that doesn’t fit the definition of
presbycusis which is non-occupational. Other gender
specific factors are more likely to be the
explanation; for instance, female estrogen
has a protective effect on hearing. However,
presbycusis can also combine with the more common
NIHL sensory-neural hearing loss (with the 4 kHz
notch) and can affect detection of both the
consonants and higher vowel formants.
There are many other factors in
ARHI, such as exposure to toxic chemicals,
and various types of medication that are ototoxic
(i.e. damaging to hearing), such as aminoglycosides,
cisplatin, salicylate and loop diuretics which are
sometimes prescribed for older people. Medical
conditions such as diabetes, renal failure, immune
function impairment and cardiovascular disease may
also play a factor.
When we are considering a life-long set of factors
that can affect health, it should not be surprising
that hearing impairment with age is mainly
correlated with overall health, as well as noise
exposure. Hearing loss is widely thought to be
“natural”, but it is more likely to be a reflection
of one’s overall health.
This type of question about
presbycusis being inevitable or not received a great
deal of public attention in the 1960s when the
American otologist Dr. Samuel Rosen studied a group
of people known as the Mabaan in the Sudan south of
Khartoum. The environment was essentially noise-free
(with typical levels below 40 dB), except during
celebrations.
In Rosen’s autobiography he says that “they walked
along the trails single file, sometimes separated by
as much as 100 yards, the length of a football
field. Yet they conversed in normal tones. The one
in front did not even turn around to reply!”.
Once audiometric tests began, he noticed much less
high frequency decline with both older men and
women, including testing the very high frequencies
of 14, 16 and 18 kHz which Western adults can seldom
hear. But it was his remark that “Mabaans aged fifty
to fifty-nine had much better hearing than Americans
aged twenty to twenty-nine” that caught the public’s
attention through media reports. In fact for years
later, a general idea that “some African tribe
didn’t lose their hearing with age” still circulated
widely.
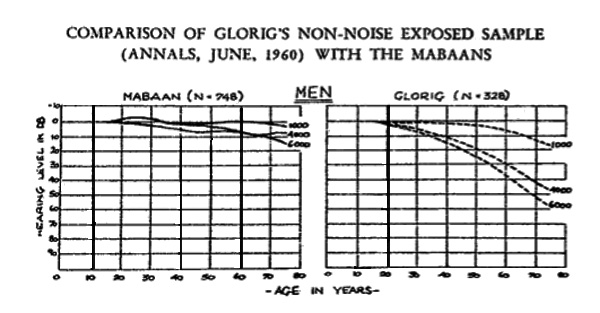
One of the graphs in his research publication (in Transactions,
American Otological Society, vol. 50, 1962) did show
this comparison between the Mabaan men aged 50-59
and American men aged 20-29 being similar, but the
American data was Aram Glorig’s 1954 Wisconsin State
Fair data with noise-exposed subjects, one of the
worst set of findings ever reported. However, to be
fair, Rosen also showed a comparison with non-noise
exposed American men, also by Glorig (1960), in this
diagram.
Recruitment. Auditory
recruitment is dysfunction of the inner ear that distorts
the dynamic range of the sounds being heard.
Low level sounds seem quieter than normal, but past
a certain threshold their intensity becomes
magnified by a non-linear amplification
and they become overly loud. This effect, which can
be made worse with a hearing aid, means that quieter
sounds are masked and the person experiences a
threshold shift after each burst of loudness that is
similar to permanent hearing loss.
Non-linear dynamic response associated with
recruitment
Tinnitus is the experience of
a persistent sound in one or both ears when there is
no external source. It is often described as a
ringing, buzzing, hiss or roaring. The term can be
pronounced with the emphasis on the first or second
syllable.
Tinnitus is generally regarded as an indicator, not a
cause, of another condition, most commonly NIHL and
presbycusis, but it can also be a side-effect of many
other medical conditions as well. As noted above, a
transient version of a “ringing in your ears” (in the
5 - 10 kHz range) can be experienced as a response to
excessive noise exposure, or medications such as
aspirin which constrict blood flow, and result in a
spontaneous firing of the hair cells.
However, with various chronic diseases it can become a
nearly constant presence and therefore create
psychological and other problems such as depression
anxiety and stress, depending on its severity. It is
estimated to affect 10-15% of the population, and
despite the search for some form of medical relief,
there are no proven medicines that can be prescribed.
However, a variety of therapies can be tried, such as
introducing sound to mask the tinnitus or distract
from it, and notching out frequencies close to the
tinnitus frequency.
Ototoxins in history.
Chemicals and drugs that have the potential to damage
hearing have been mentioned several times in this
module. However, they have a much longer history.
Historian Hillel Schwartz’s encyclopedic tome Making
Noise (Zone Books, 2011) documents the long
history of noise (which his subtitle alliteratively
reminds us is “from Babel to the Big Bang and
Beyond”), and provides amazing detail about the
Industrial Revolution’s introduction of countless
sources of noise.
However, he also points out that in the 19th century,
exposure to ototoxic chemicals (such as lead, mercury
and solvents) was widespread, high fever diseases were
common and produced hearing loss in both children and
adults, and that the medicines that were available
(quinine, morphine, cocaine in its alkaloid form, and
by the end of the century, aspirin), all of them could
be ototoxic and result in tinnitus, depending on the
dosage (pp. 368 ff). So what if anything constituted
“normal hearing” at that time?
Audiometers and sound level meters were not invented
until the late 1920s and early 30s with the electrical
developments at Bell Labs that we have mentioned
several times. So, at that point of the ability to
quantify sound (and hearing), the modern concept of
what was “normal” and “impaired” began to be
solidified. Likewise, noise abatement measures began
to be put in place, as documented for Europe and North
America by Karin Bijsterveld in her comprehensive Mechanical
Sound (MIT Press, 2008). However, damage risk
criteria for industry, at least in North America, had
to wait until the 1970s.
Index
D. Damage-risk criteria. The
institutionalized approach to risk management
usually involves establishing risk
criteria and appropriate standards to
guide exposure. In North America, these criteria
for the workplace were slow to be adopted in terms
of risk to hearing, but in 1971 the Occupational
Safety and Health Act in the U.S. came into effect
for noisy industrial environments, to be
administered by the OSHA (Occupational Safety and
Health Administration) in the Department of Labor.
As might be expected, the initial guidelines were
a compromise between industry, worried about
costs, and audiologists who were more concerned
about aural health. These first guidelines were
stated as shown here.
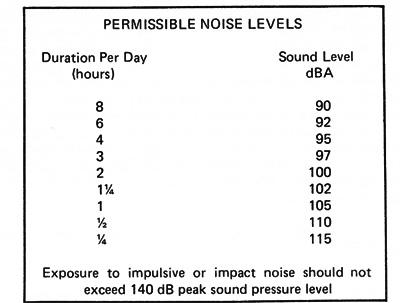
The main two characteristics of the criteria were
the 8-hour exposure limit (set to 90 dB,
whereas audiologists recommended 85 dB) and the “exchange
rate” of 5 dB increase for half the amount
of time (whereas audiologists would have preferred
a 3 dB rate). There was also a general reference
to impact noise measured at peak levels.
The other problem with this initial set of
criteria is that it was labelled as “permissible”
levels, but which were clearly not “safe”
levels. In other words, they did not guarantee a
lack of occupational hearing loss, as some might
have assumed. Some commentators have suggested
something along the lines that at these exposure
levels, a hearing loss of no more than 15 dB would
be experienced by 1/3 of those exposed.
A larger issue that has been
raised by some critics, such as Raymond Hétu from
Québec, is that this approach solidified hearing
loss as the main basis for regulation and
compensation, as administered by audiologists
using audiometric methods. Given the range of
noise effects that will be outlined in the next
module, there are many more consequences of noise
in the workplace, many of which can increase the
risk of accidents, as in Hétu’s diagram here.
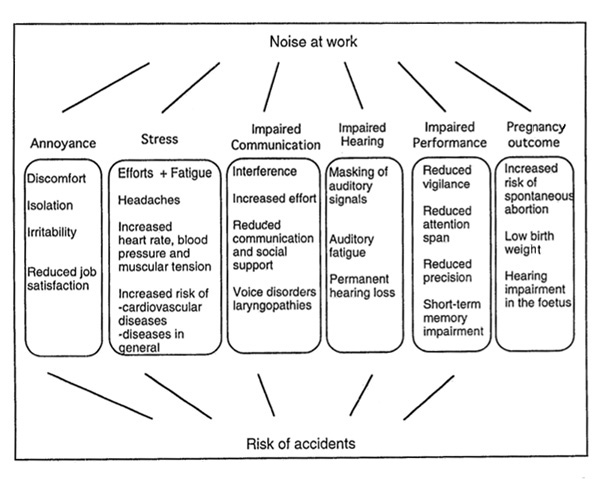
Outline of
the effects of occupational noise exposure
(source: Hétu)
In more recent decades, there has
been a move by regulators towards hearing
conservation programs. This involves providing
annual hearing tests for workers (in medium to large
business and industrial operations), and prescribed
levels of hearing protection based on the
time-averaged noise levels that have been measured.
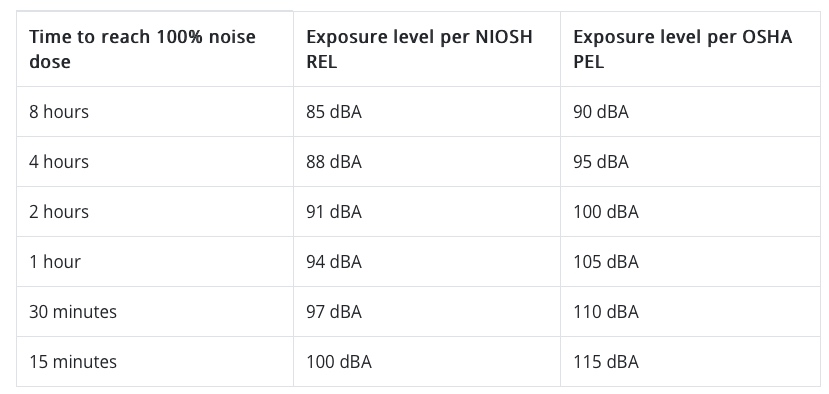
Many jurisdictions now follow the standard of 85
dBA time-weighted exposure over 8 hours, and a 3
dB exchange rate (that is, halving the
duration of exposure for each 3 dB increase in sound
level, as recommended by the NIOSH (National
Institute for Occupational Safety and Health). The
aim is to reduce the risk of occupational NIHL, and
a comparison of OSHA and NIOSH criteria is shown
here. Note that the time-weighted level Leq
will be explained in the next module.
The effectiveness of personalized
hearing protection is measured as a NRR value (Noise
Reduction Rating), although its actual
effectiveness depends on the fit and pattern of use
by the user. Some estimates show that actual use is
often about half of the maximum value. The following
chart shows how to calculate the estimated noise
exposure level using the NRR value, for earmuffs,
earplugs and their combination (“dual protection").
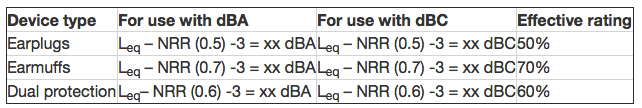
For instance, with a Leq of 98 dBA and a
NRR of 30 for earplugs, the estimated noise exposure
is 80 dBA, with an effective rating of 50%. With
earmuffs, that value would be reduced to around 74
dBA (effective rating of 70%). Of course these
values assume an ideal fit for the protection and
100% use.
The best protectors are the closed over the ear
headphone or earmuff type protectors (class A), with
soft foam earplugs or fitted plugs as class B if
they can reduce levels by 30 dB. It is important
that the reduction is fairly uniform across the
entire range of frequencies so that speech can still
be understood, given that high frequencies are easy
to attenuate, but low and mid-range ones are not.
There are some misconceptions about hearing speech
or other signals when using earplugs. Research shows
that it is easier to detect and comprehend these
sounds when the ambience is lower, particularly if
all frequencies are reduced by about the same
amount, and therefore it is better to use earplugs
in those situations, as speech may be better
understood.
Impulse content of noise.
The criteria described above are solely based on a dosage
model, which is basically averaged noise level
plus duration of exposure. In the past, a dosimeter
(or "dosemeter" in the UK) was sometimes used,
attached to the worker’s clothing, to determine the
dosage of the exposure, a procedure that could
easily produce a flawed result as the worker moved
about.
Today, the Equivalent
Energy Level, or Leq, can do
a better job and is incorporated into many portable
sound level meters and apps, and the averaged result
can be measured over any length of time. It is
usually A-weighted (in dBA) and therefore
discriminates against low frequencies, with the
traditional justification that dBA “reflects how we
hear”, a non-technical reference to the Equal
Loudness Contours from which the
A-weighting scale was derived for low
intensities (the 40 phon curve) as described
in the Magnitude
module. However, you can see a reference to dBC
levels in the chart above, which does include
low-frequencies, but that weighting network isn’t
always available and cannot be used in windy
conditions outdoors.
On the other hand, it has been known for several
decades that industries where impulsive noise
content is prevalent, such as with a punch press, or
in the impact sounds made by glass and metal hitting
each other, or other types of mechanical operations,
average risk limits for 50% hearing loss are lower
and therefore the risk can be greater, as shown here
from a report in the 1970s in Europe.
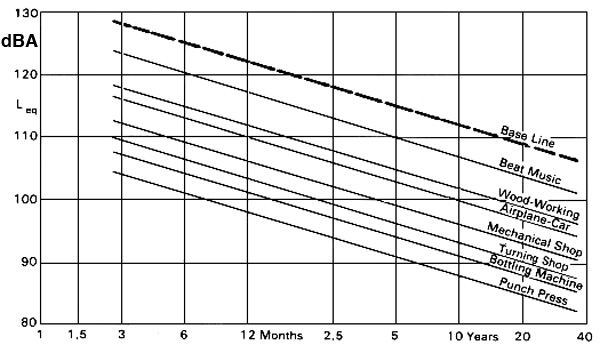
Risk limits for different industries with
impulsive content (source: Brüel)
Note that the lower the line, the higher the risk
because of impulsive content in the typical sounds
of that industry (that is, the risk of hearing loss
is the same at a lower level). It is a small comfort
that amplified pop music (which the Europeans call
“beat music”) is less risky because the audio
equipment cannot reproduce the brief transients that
are the problem. However, the same dosage model
(level plus duration) still makes amplified music as
dangerous to the ears as any other industrial noise.
What has not become generally integrated into risk
criteria today is the impulsive content of
sounds. Everything we have described so far relates
to steady noise levels. Admittedly the Leq
measurement will include the energy of brief
transient sounds, but it is not clear what
time-scale should be used, as many of these
transients can last under 100 µs (microseconds). In
the following diagram, we can see examples of these
short transients in a beer bottling plant. Note that
the strongest spectral energy is in the 2-3 kHz
range.
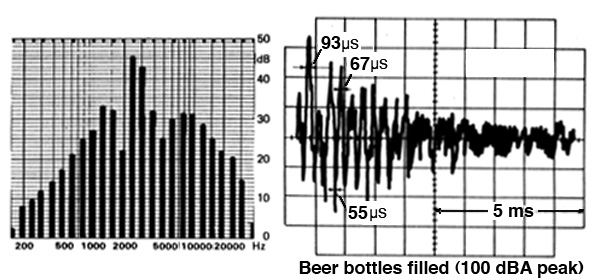
Spectrum and waveform from a bottling plant
showing brief impulsive transients (source: Brüel)
Traditionally, the sound level meter (SLM) has had
two settings for its temporal response, slow
(for visually averaging a time-varying sound with a
1 second averaging time), the fast
response for tracking rapid transient sound
levels, and the impulse response for peaks. The fast
response of the meter at 125 ms is closer to
the brain’s own averaging time, which also
determines the apparent loudness of a sound, as
demonstrated in the demo
with short clicks. The impulse meter (now seldom
used) has the time constant of 35 ms.
In fact, if you watch a SLM fluctuate on the fast
scale, it is easy to see the correlation between
what you are hearing and what is being measured.
However, the danger with impulsive sounds arises
because there is nothing preventing them from going
directly into the inner ear and causing
damage. The averaging times for the outer and middle
ear are in the microsecond range. Moreover, as
documented above, the natural amplification of the
sound wave in the outer and middle ear is 10-12 dB,
and as we just saw in the above diagram, that
frequency range is where most impulsive energy lies.
20. A personal listening experiment
for this effect (but don’t do it for very long) is
when you hear bottles hitting each other, or a
series of metallic impacts, or even hammering at
close range. They won’t sound that loud, but you can
often feel an after-effect of discomfort or a
Temporary Threshold Shift. If you have to work in
such an environment, use hearing protection!
Of
even greater concern is that some children’s toys,
such as a toy “cap pistol”, or fireworks, can also
produce very strong pressure transients.
A peak sound level measurement
represents the true maximum pressure of a sound wave,
so for instance, a sine wave’s peak (as opposed to its
RMS
value) is 3 dB higher than its SPL (sound pressure
level). In a digital meter, there is no time weighting
involved, but keep in mind we are dealing with time
values near the sampling period (e.g. 20.8
µsec for a 48 kHz sampling rate), so higher sampling
rates will need to be used.
In terms of damage risk criteria, there are some
guidelines about impulsive content, such as an upper
limit of 135-140 dB peak levels, but as yet,
there is no agreement on exactly how the true peak
levels should be measured and how the threshold of
risk for hearing loss is determined. There is also no
satisfactory way of combining the measurement of
steady state noise with impulsive content.
Index
Q. Try this review quiz
to test your comprehension of the above
material, and perhaps to clarify some
distinctions you may have missed.
home