 |
VIBRATION |
Frequency and Pitch
|
VIBRATION |
If magnitude is considered as the vertical dimension of sound, then the horizontal dimension is that of the time behaviour of sound. What is common to all sound is a pattern of change over time called an oscillation or vibration. It need not be necessarily regular or repetitive, but there must be a series of oscillating changes that allow energy to travel or change media, whether it is a sound wave or a sound signal.
The description, measurement, and subjective response to this aspect of sound is probably the most complex (and fundamental) of the entire field, and although a great deal is known, even more distinctions are commonly made in language, music and the environment that depend on vibrational phenomena. We present three very broad categories, followed in the next module by several more:
(click on the link under the capital letter to go to that section)
A) Oscillation, the sound wave and its basic parameters
B) Modes of vibration, resonance phenomena
C) Pitch (the subjective sense of frequency) and musical systems for organizing pitch
These topics will deal with frequency and the frequency content of individual sounds under more or less ideal conditions. The interaction with the environment, with other sounds, with the auditory system (in the sense or hearing ability), and the manipulation by electroacoustic devices will be left to other modules of this document.
Q) A review quiz
home
A) Oscillation and Frequency. The basic nature of sound as a physical vibration – one that requires a medium of transfer such as air, a solid or a gas – is an example of oscillatory behaviour. Oscillation in a medium gives rise to the propagation of a wave, the series of oscillations that carry energy, and from a listener's perspective, provide information. Here we present the basic parameters of oscillation, the most common of which is its frequency of vibration.
In textbooks, it's common to show an oscillation in a two-dimensional form, like this, a pattern of sound pressure over time:
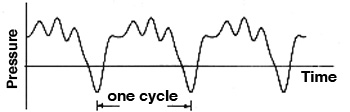
However, this type of diagram of a sound can be misleading in a number of ways:
- this waveform above is periodic, and one cycle is marked out, but it looks like it is repeating exactly, whereas all acoustic sound, even when periodic, will have some variations in each period; if you were to hear this sound, it would seem very synthetic and artificial, but it would have a defined pitch as described below
- the diagram below also shows an oscillation - with its continuous variations in amplitude regarded as positive and negative around an undefined "zero" line; however, the variations shown here are random, instead of periodic, and therefore it is still an oscillation, but it sounds unpitched and can be described as noise; this example is called pink noise
- these waveforms are shown as a type of wave where the amplitude variations occur vertically, and time is shown horizontally, that is, at right angles to each other; this is called a transverse wave and is not what happens in the air (but what does happen in a skipping rope, for instance, where the variations are vertical compared to the direction of travel of the wave); it's hard to diagram what happens three-dimensionally in the air, but one kind of two-dimensional attempt might look like this:
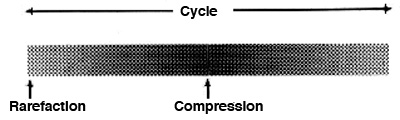
Here the increases and decreases in sound pressure are shown above as lighter and darker regions (called rarefactions and compressions, respectively) which occur in the same direction as the propagation of the wave; hence this is an example of a longitudinal wave, a little like what might occur in a coiled spring (think of a "Slinky"!)
So, to summarize, the first diagram provides some basic terms that can be used to describe a periodic sound:
- frequency: the rate of repetition, formerly called cycles per second (cps), but now referred to in Hertz (abbreviated Hz, capitalized in honour of the German physicist Heinrich Hertz who proved the existence of electromagnetic waves in the 19th century); frequency is usually symbolized by the lower case letter f, and commonly referred to as high, medium or low (this rather universal vertical metaphor is difficult to explain, but it does have the advantage of being distinct from the speed of sound
- amplitude: the continuous variation of, for instance, sound pressure (when we're referring to air) around normal atmospheric pressure; in practice, however, when we refer to the amplitude of a waveform, we usually mean its maximum amplitude either above or below the zero line; peak-to-peak amplitude would be its total amplitude from top to bottom
- waveform: this is short form for the "shape" of the wave, but since it's always changing with acoustic sound, the more common reference is to a synthesized audio waveform where it is fixed (and usually boring to listen to); these "shapes" are better described by the frequency spectrum they are comprised of (covered in the next module of the tutorial)
- period: this is the duration of a single cycle in a periodic waveform and is the inverse of the frequency; so, if the period is 1/100th of a second, the frequency is 100 Hz; if it is 1 ms, then the frequency is 1000 Hz or 1 kHz; the period is usually symbolized by the capital letter T; therefore
T = 1 / f
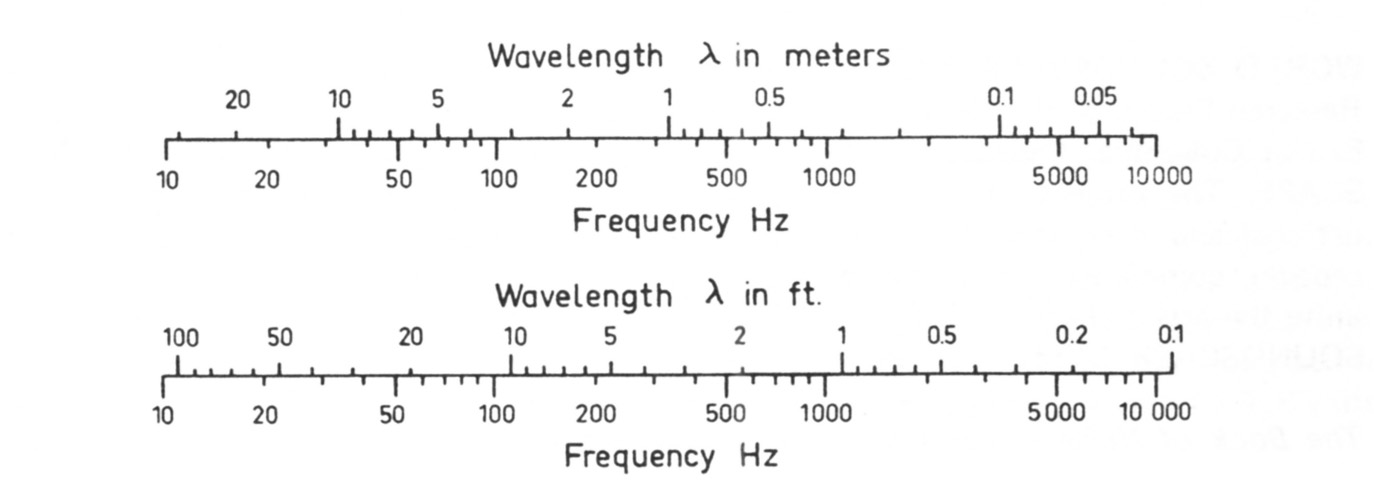
- wavelength: this is the distance travelled in one cycle of the waveform; low frequencies have very long wavelengths, and high frequencies have very short ones, so like the period, it varies inversely as the frequency; note that the actual distance will depend on the speed of sound which in turn depends on the temperature – sound travels faster in warmer temperatures; it is usually symbolized by the Greek letter λ, and the relation to frequency f and the speed of sound v is given by the equation:
v = f . λ or f = v / λ
This chart shows the wavelength of sounds of various frequencies travelling in air around 20° C (or 68° F), which is about 344 metres/sec or 1130 ft/sec. Note that a low tone of 100 Hz has roughly a 10 foot (3 metre) wavelength and a 1000 Hz tone (also called 1 kHz) has a 1 foot (1/3 metre) wavelength.
FUN EXERCISE: During a pandemic we're advised to keep a 6 foot (or 2 metre) social distance. Using the right-hand equation above, calculate the frequency whose wavelength this corresponds to, and use the Handbook Appendix to find the pitch that represents. Answer here
Also note that whereas the above five parameters can be used to describe a periodic waveform, an aperiodic waveform can only be described as having amplitude using those terms; instead, it can be characterized by its spectrum (covered in the next module of the tutorial).
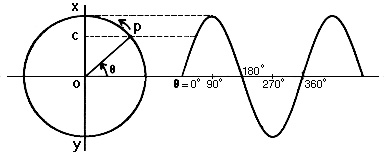
The other common representation of a basic oscillation is the diagram of a sine wave, which in fact is a mathematical function related to the angular properties of circular motion, and derived from a model called Simple Harmonic Motion (SHM).
This theory follows Newton's Third Law relating an action to an equal and opposite reaction, such as a push followed by a pull. So, imagine striking one tine of a tuning fork. The energy displaces the tine in one direction and inertia pulls it back in the opposite direction. In the real world, energy is lost and the resulting oscillation dies away. But in theory, it would continue in SHM as diagrammed above. Now imagine that the tine has a pen attached to it and you could trace its movement on a moving piece of paper – then you'd get the wave shape shown on the right.
Mathematically its shape is the projection on the vertical axis (XY) of a point P moving around a circle. At the instant shown, it is at the angle θ and therefore the value of the sine wave (projected as C on the axis) is sin θ. Note that if the point P is half way around the first quarter of the circle (45 degrees), its value is not 0.5, but .707, that is, the value is 70% of the maximum value, so the shape of the sine wave is not like a semi-circle (as it's sometimes crudely drawn), reflecting that the point is, in a sense, slowing down as it reaches the maximum amplitude, just as you'd feel on a swing as you approached the highest point (where you are momentarily at rest) before returning. Sine wave
The frequency of the vibration is therefore related to the speed of the angular rotation where θ can be thought of as the phase of the vibration. Hence, instead of just thinking of frequency as related to a periodic vibration, we can have a more inclusive idea:
frequency is the rate of change of phase in any oscillation
Although the implications of this concept may not be apparent at this stage, it will turn out to have an important role in the topic of Microsound, so stay tuned!
Index
B) Modes of vibration. The first section was largely a theoretical one based on the physics of oscillatory behaviour. As described in the opening module of the tutorial Sound-Medium Interface, in the real world, physical objects and enclosed spaces are set into vibration only at certain resonant frequencies called the resonant modes of vibration. This is because the energy transfer from the original source is maximized at those frequencies, and so the sound that results is a combination of precisely those resonant frequencies. It is not a coincidence that the objects and spaces that produce these resonant modes are simple, for instance the one-dimensional string and tube.
From time immemorial, it appears that humans have been fascinated by those resonances which are in harmonic proportions and therefore produce a strong sense of pitch - exactly the situation optimized in the design of acoustic musical instruments. However, all of the sounds from the natural world follow the same principle, except that the objects and spaces that produce them are much more irregular and therefore do not include harmonics.
In between are the special cases of resonant modes that are inharmonic (with likely an indefinite collective pitch), and those with slightly broader resonant modes than the pure harmonics, most commonly referred to as formants as in specific vowels. But let's start with the simpler cases of the string fixed at both ends, and a tube open at both ends.
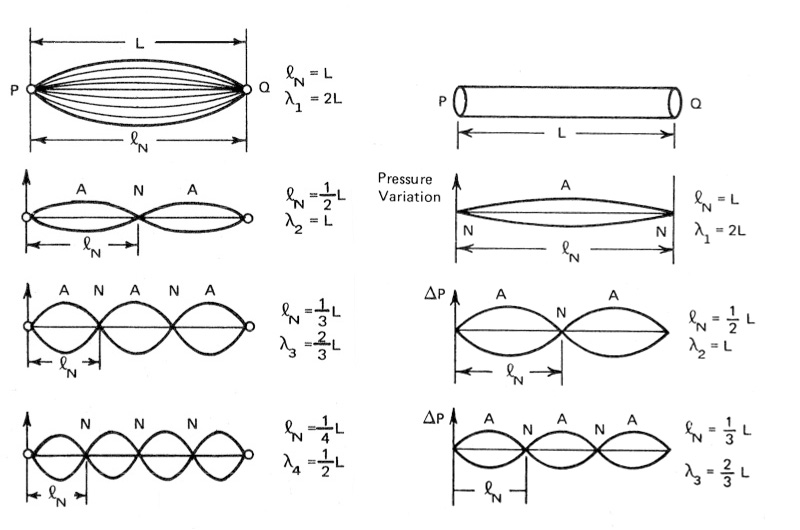
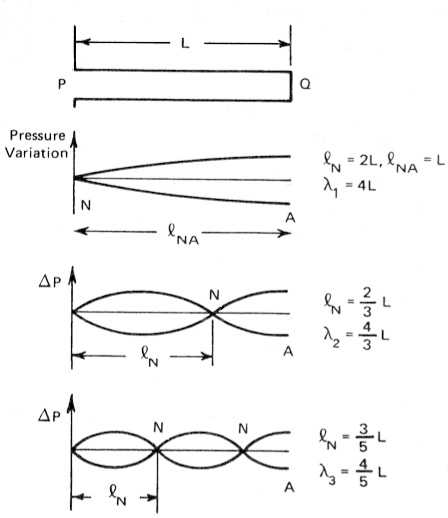
The diagrams on the left side are for a string, length L, fixed at both ends, and on the right, we have a tube of the same length open at both ends. The sinusoidal lines in each set indicate the possible vibrational modes of the string in terms of its displacement, and in the case of the tube on the right, the diagram switches to pressure variations ΔP – mainly to keep the diagrams looking similar.
In the case of the string shown above, it is fixed at both ends, so there is no movement at those points (called nodes, symbolized by N), whereas at different points in between there are points of maximum movement and displacement, called antinodes (A) or loops. The top diagram for the string shows that the simplest mode of vibration is a half wavelength.
That is, this mode of vibration could be described as N - A - N which corresponds to a half sinusoidal wavelength. The wave is then reflected at the other end creating what is called a standing wave, which means the position of the nodes and antinodes are fixed in space, so there is no net movement of the wave (i.e. movement of the waves in both directions cancel each other out). This mode of vibration is call the fundamental frequency and first harmonic which has a wavelength that is twice the length of the string.
Watch this video to see an animation of a standing wave in a string;
the blue wave is travelling to the left, and the green to the right, with the red line being their sum;
the nodal positions (zero points) in the red line are fixed and the video ends with all three being lined up.
(source: USNW)
However, the string can vibrate in many modes that are multiples of the fundamental f. The second diagram below the top one shows the second harmonic with a pattern of one full wavelength (including a node in the middle) and a frequency of 2f. This pattern continues with the 3rd and 4th harmonics that vibrate with 1-1/2 and 2 wavelengths and frequencies of 3f and 4f, respectively.
In theory there are an infinite number of harmonics, called the harmonic series, but in practice the amplitude of each harmonic will decrease. Note that each harmonic will have the same number of nodal positions minus 1 as the harmonic number (e.g. 1 node for the second harmonic, 2 for the 3rd, 3 for the 4th, and so on). The fractions at the right of each mode indicate the nodal position spacing, and the wavelength of the mode in terms of the length of the string L.
All the possible modes of vibration combine simultaneously to create the sound of the string, whether plucked or bowed); however, with the string, it is possible to eliminate some of the modes by touching the string lightly at a nodal point (which doesn't vibrate in that mode anyway). This will damp (i.e. attenuate) most of the other modes.
So, lightly touching the middle of the string eliminates the fundamental and we will hear the 2nd harmonic sounding an octave above but on the same pitch. Technically the harmonics 4, 6, 8... are still there as well but will have less energy. In any event, the harmonic tone that remains seems very pure and even ethereal, an effect that was famously demonstrated by Pythagoras with a single string, or monochord, over two millennia ago. It probably seemed like discovering a hidden order and beauty, as well as a simple number pattern, 1 2 3 4... for the harmonics, and 1, 1/2, 1/3, 1/4... for the nodal positions.
So in summary, the string vibrates as a whole and in "parts" (hence the term partial as an alternative to harmonic) where each component is a member of the harmonic series of integer ratios. In some texts, the term overtone will appear, but it is rather confusing since the 2nd harmonic is the first overtone (i.e. the first tone over the fundamental), so we will avoid that designation.
On the right of the above diagram, we see the same pattern played out inside a tube open at both ends; all of the harmonics are present in the same pattern. However, what is invisible is how the pressure changes from its nodal positions (i.e. minimum pressure) at each end, through to various antinodes (i.e. maximum pressure) inside the tube.
The Western tradition (i.e. Greek myths) has it that the first string instrument might have been with tendons on a tortoise shell, and the first tube was a hollow reed (a predecessor to the recorder and flute), although actual archeological evidence shows that the first musical instrument was probably a bone flute.
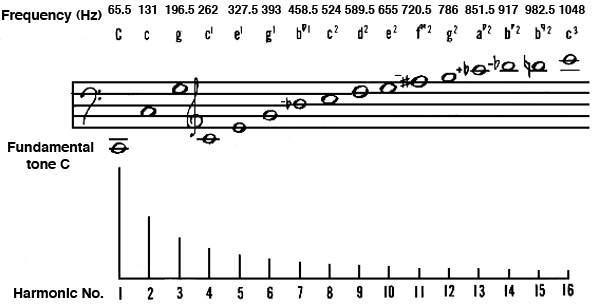
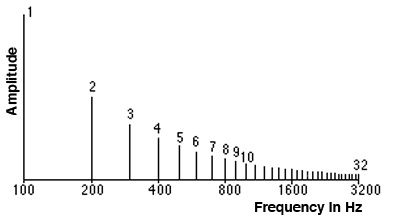
The bottom part of this diagram shows the Harmonic Series as a set of equally spaced frequencies on a linear scale where the distance between them is the same as the fundamental frequency f. That is, the series is f, 2f, 3f, 4f, ... Above that is the musical notation for harmonics based on a fundamental of a low C at 65.5 Hz.
The first thing for a musician to notice would be that the intervals between the harmonics are decreasing in size from an octave to a fifth, a fourth, a major third and a minor third over the first six harmonics. The difference between the acoustic and the musical representation is that the acoustic one is shown on a linear frequency scale, i.e. the distance between the harmonics is the same.
The musical scale represents a logarithmic scale where the musical interval is based on the ratio between the frequencies (e.g. harmonics 1, 2, 4, 8 all have an interval of 2:1 between them, namely the octave). Here is a diagram of the Harmonic Series on a logarithmic frequency scale - which corresponds to the way we perceive them, that is, the distance between the harmonics gets smaller and smaller. Also, note the octaves are equally spaced. A tone comprised of a set of harmonics like this is called a complex tone, even though the lack of time variation in its components make it seem rather simplistic and synthetic.
These harmonic intervals are the same ones used in Western harmony for major and minor chords. So, up to this point (as theorized by Rameau, for instance), nature and culture seem to coincide. But then comes the 7th harmonic which is not exactly the same as the interval of the minor 7th. Likewise for harmonics 11, 13, 14 and 15, until the octave returns with harmonic 16. This topic will be returned to below in terms of musical tuning systems. but at this point, let's listen to the harmonic series, as recreated with sine tones.
To finish off this very small number of one-dimensional modes of vibration, consider the tube open at one end, P, and closed at the other, Q. Harmonic series of sine tones, up to the 16th harmonic
In this configuration each mode of vibration shown above has a node (i.e. minimum pressure) at the open end and an antinode (i.e. maximum pressure) at the closed end. The fundamental mode of vibration is a 1/4 wavelength and therefore has a wavelength 4 times the length of the tube. The next mode of vibration is not the 2nd harmonic, but the 3rd, with a 3/4 wavelength, and next the 5th harmonic with a 5/4 wavelength.
The result is a set of odd harmonics, 1, 3, 5, 7..., omitting the octaves (2, 4, 8) found in the string and open tube. The resulting sound is more "hollow" as a result, and sounds an octave lower than an open tube of the same length. This tube will sound more like a clarinet that also has weak even harmonics, and strong odd ones.
6. Personal listening experiment: Take a bottle of any size with a narrow neck that contains something you can drink (this is an multi-sensory experiment). As you drink more of the contents - within reason - try blowing across the mouth of the bottle. Does the resonant pitch get higher or lower as you drink? Here's the answer. Let's listen to some real acoustic instruments where we build up their sound, starting with the fundamental (note how weak it sounds in each case), then adding one or more harmonics at a time. In each example, note at what point you can a) identify the instrument and b) how its sound was activated, as revealed by the beginning part of the sound called the attack. Listen to the examples more than once, before you check the answers, since after the first listening you'll likely already recognize the instrument.
Electroacoustic music students, and those interested in sound synthesis may like to explore this physical model of a string or tube called the Karplus-Strong resonator. It simulates a string being plucked, or the equivalent with a tube open at one end and closed at the other, using digital delay lines with feedback simulating resonance. The sound examples also include one where the delay line is fed with the noise of bowing on a cello bridge as the excitation function.
The take home message: resonance is vibration with boundary conditions.
Modes of vibration in objects with more than a single dimension.
The pattern of resonances gets complex very quickly once more dimensions are available in the sounding source. A plate, circular or square, might be considered next.
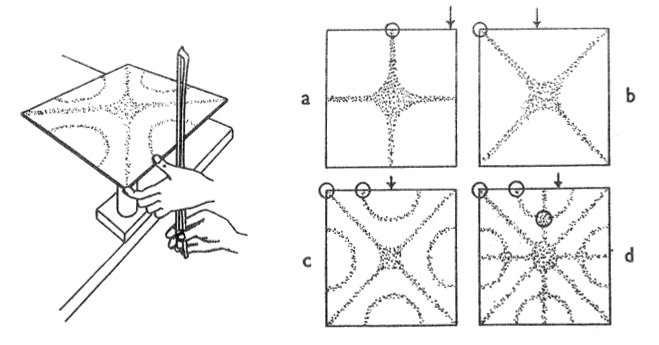
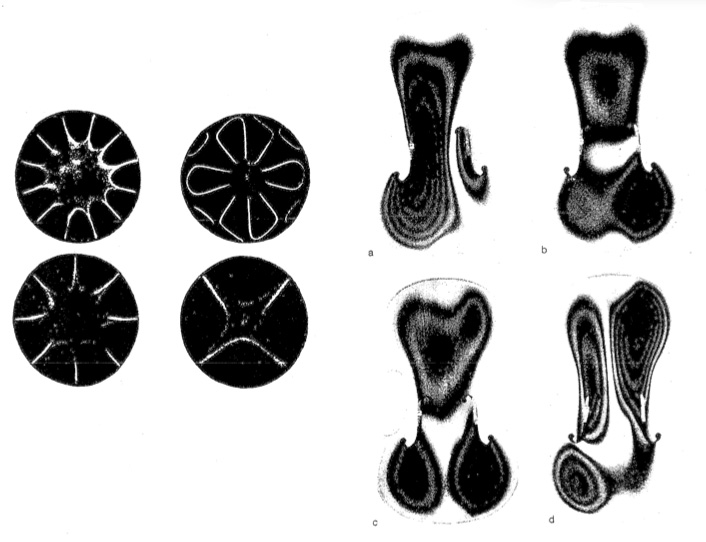
This diagram shows a traditional demonstration of more complex modes of vibration, using a Chladni plate named in honour of the German physicist and musician, Ernst Chladni (b. 1756) who demonstrated these figures with a flat plate supported in the centre, which was then bowed at a position marked with arrows on the diagrams. The plate was covered with fine sand or powder which could accumulate along the nodal lines. Instead of touching a point on a string to damp some harmonics, one or two fingers touched the plate at positions indicated by the circles, thereby damping some modes and allowing the rest to disturb the particles until they came to rest along the remaining nodes.
By definition there are nodes where the fingers touch the plate, and at many of the touched positions, elaborate and often beautifully symmetric patterns can be seen. Chladni himself demonstrated the effect to Napoleon and other scientists, but the effects of the intriguing patterns have held the public's interest ever since, possibly because of the seeming "magic" of rendering sound visible and complex, at least in the pre-electrical age.
Today, a standard demonstration is to excite the plate with a single frequency tone generator that continually rises in frequency. When it corresponds to a mode of vibration in the plate, the nodal figures suddenly emerge and re-configure themselves.
Watch this video to see an example of this form of excitation of a plate. (Source: FreeScienceLectures.com)
Another visualization method of modes of vibration is the Rubens tube, which is gas filled and allowed to burn at various closely spaced openings along the tube. The height of the flames mirrors the nodal and antinodal positions - and creates a high sense of drama! Other techniques for the visualization of sound - increasingly impressive in recent years - are grouped under the term Cymatics and illustrated in a variety of online videos.
Watch this video to see an example of a Rubens tube; note that the nodal positions allow more gas to escape, not less.
(Source: www.youtube.com/watch?v=HpovwbPGEoo)
This diagram at left shows some Chladni figures in a circular plate, and at right, dark nodal lines are shown holographically in a violin body. Because of the violin's irregular shape, it exhibits highly complex modes of vibration. This is desirable in an instrument where many pitches need to be resonated, not just a few in the harmonic series, hence the complexity prized in a finely crafted instrument to be complex resonators that provide the rich tone of the instrument.
Violin without and with the body resonance
Modes of vibration aren't always beneficial, as they usually are acoustically; the infamous collapse of the Tacoma Narrows bridge in 1940 began with a first mode of vibration that gently gave it a wavelike motion (and the nickname "Galloping Gertie") as can be seen here
But then a second mode of vibration occurred, initiated by a 42 mph wind, this time with waves going side to side every 5 seconds, thereby creating a torque on the bridge which inevitably collapses, as seen here.
Index
C) Pitch. Pitch is a subjective sensation that results from the perception of periodicity in a sound wave. Therefore, it is one of the primary perceptual variables in psychoacoustic research, particularly because of its role in music and speech. It mainly correlates with frequency, as described above, except that we have already demonstrated that, except for the sine wave (which has to be synthesized), all periodic vibrations we encounter have more than one frequency component. In the next module, we will examine various types of spectra (the plural of spectrum), not all of which will produce a pitch sensation. This leads to a very tricky, but fundamental question:
When does the frequency component of a sound lead to a pitch sensation and when is it a component of the perceived timbre?Let's first clarify what range of frequencies we are referring to. Audiologists usually refer to the range of human hearing as 20 Hz to 20,000 Hz (or 20 kHz), and biologists will point out that other species have a much higher upper limit, which for humans is the range of ultrasound, i.e. frequencies above the upper human limit. Also, keep in mind that most adults cannot hear frequencies above 14 kHz, and not above even lower ones as age progresses (as will be discussed in the Audiology and Hearing module). Still, the 20 Hz to 20 kHz range is always cited for human hearing.
Similarly, many species may also be more sensitive to frequencies below 20 Hz, referred to as infrasound. For humans, the infrasound range is where the entire body feels a vibration. Note that above, we used oscillation and vibration fairly interchangeably, so it's probably wise to use the term low frequency vibration when we are referring to infrasound. These vibrations can affect the body quite strongly, with a lot of individual variation in sensitivity, and will be discussed further under Noise Measurement. In that context, low frequency sound often refers to any acoustic sound below 100 Hz, particularly because most mechanical sounds have a lot of energy in that range, including both noise and pitched sounds, as well as infrasonic vibration.
In terms of pitch, that sensation begins to emerge around 20 Hz where the rate of vibration begins to exceed 50 ms (which has a periodicity of 1/20 sec). This represents the threshold of perception where individual events or pulses are no longer perceived separately, but fuse into a new and continuous sensation, such as pitch. We might also call this an digital-analog threshold where discrete events become fused. As it turns out, the visual system operates similarly as when the individual frames of a film fuse into a continuous image at the standard 24 frames/second speed.
Musical pitch is a subset of the 20 Hz to 20 kHz range. The lowest note on the piano is a low A at 27.5 Hz, and the highest C on a piano or piccolo is tuned to 4186 Hz. A soprano's "high C" is 1046 Hz, and the singing voice even for an opera singer can only stay briefly in the octave above that. Likewise, a bass voice will find it difficult to go below an E (at 85 Hz) nearly two octaves below middle C. Only few instruments, such as the tuba, or contrabass trombone, can go below that.
So, it is not surprising that our sense of musical pitch, for both melodic intervals, and harmonic chords, functions best in the middle ranges, which are generally middle C plus or minus two octaves (i.e. approximately 60 - 1000 Hz).
Psychoacoustics of pitch. In this middle range, our sensitivity to pitch at moderate levels of loudness is very great. In the first module we showed an experiment where most of us could detect about a .1 - .3% difference in sine tone frequencies. This is largely because it depends on the temporal firing of the hair cells in the middle ear. A more detailed account of their structure and functionality will be discussed in the Audiology module.
As we will discover in the next module, it is these same hair cells that will react to all frequencies in a given sound and give rise to the sensation of timbre. How can these hair cells do both? The quick answer here is that it is the spatial position of the hair cells responding to all of the frequencies in a spectrum that provides the auditory cortex with spectral information. Here, a pattern emerges: the brain is receiving both temporal and spatial information to make rapid judgments about complex sonic input. The temporal information about pitch is fine grained, and the spatial information about the spectrum is much broader.
To illustrate the efficiency of these two mechanisms, here's a sound example where harmonics 1 through 10 are cancelled and restored in a complex tone, that is, they are turned off and on. Note how each harmonic is embedded in the timbre initially, and only recognized as a pitch when it is cancelled and restored.
Cancelled harmonics video In listening to these quick changes in the sound, try to catch the fleeting moment when the sound first starts and we hear it as a whole, a fused sound with a particular quality to it. This mode of listening can be termed holistic. Then a fraction of a second later, a harmonic is cancelled and quickly reinstated, and our attention is drawn by these sudden events and we hear the pitch involved, sometimes alternating with the neighbouring one above it. This type of perception can be termed analytical, as it focuses on detail to which our attention is drawn (ironically in this case by a sudden absence). It is the rapid and effortless switching between these modes of listening that is the most remarkable.
Another issue with pitch perception that mainly serves to show how musical practice, as it has evolved culturally, may be at odds with psychoacoustics, is the proposed scale of equal pitch increments called the mel scale. Musicians learn to identify intervals as the "same" whether they are in a low, middle or upper register, despite the fact that their psychoacoustically perceived distance is quite the opposite; the interval of the major third, for instance, sounds medium-sized and consonant in the mid range of pitch, much smaller and more dissonant in the low pitch range (and therefore is seldom used in music), and seems very large in the high pitch range.
Musical pitch and tuning. The adjustment of musical pitches is referred to as tuning (a metaphor that Murray Schafer used in titling his book The Tuning of the World). Historically, most cultures seem to have organized musical pitches into particular sets of pitches, called modes or scales. In the Western tradition, the Greek modes (Ionian, Dorian, Phrygian, Lydian, Mixolydian, Aeolian and Locrian) seem to involve not just a set of pitches, but their typical melodic uses. Today, modal music can refer to music composed of any set of pitches, whether traditional sets or not, whose melodies are not driven by the harmonic progressions that are typical of conventional Western music in equal temperament organized into a standard set of scales such as C major or C minor, which are known as keys.
Tempered tuning is one where the pitches have been adjusted from those based on specific ratios (such as found in Just Intonation) and Equal Temperament is a system of tuning where the octave is divided into equal sized intervals. It was noted above in the discussion of the harmonic series that the intervals between harmonics get smaller with each higher harmonic. When the notes of a scale are organized with intervals in simple number ratios, as in Just Tuning, the size of each interval in the scale is different. This limits the musician's ability to transpose (i.e. shift) a melody or chord up or down on a keyboard instrument where the tuning is fixed.
By tuning to the system of Equal Temperament, the octave is divided into 12 equal parts, with the smallest step, called a semitone, being 1/12 of an octave. Thus, any melody will stay recognizably the same when shifted up or down in this system.
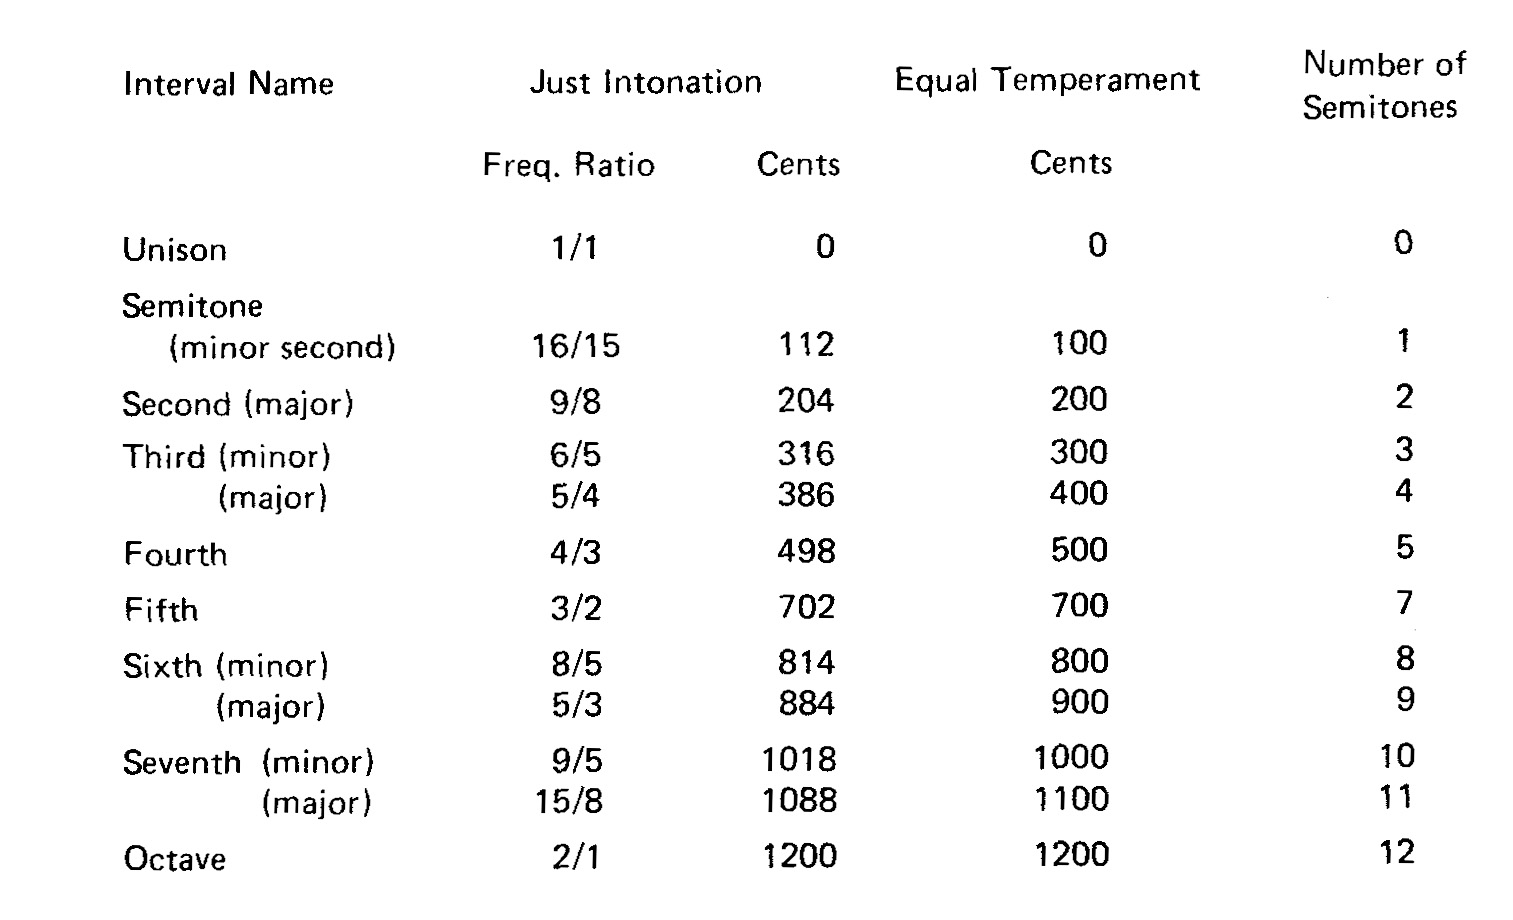
In order to measure the small frequency adjustments that are being made in such tuning systems, the frequency unit of the cent was devised, where 1 cent is the 1200th root of 2 – a mathematical way of saying that the 2:1 interval, the octave, is divided into 1200 equal (and very small) intervals, such that the semitone is an interval of 100 cents.
In this chart you can see the set of musical intervals based on ratios in Just Intonation, and their equivalent in cents. In the next column are the same intervals in Equal Temperament, which are neatly arranged in multiples of 100 cents. By using the unit of the cent, we can see that the only interval that is identical in both scales is the octave (2:1). The next interval from the harmonic series, the 5th (3:2), differs by only two cents between the Just and Equal Tempered scales.
A traditional piano tuner who is listening for the beats between two notes a fifth apart might use this indicator when tuning (whereas today a tuner is more likely to be matching the pitch to a digital reference sound). In the debate between the merits of the two tuning systems, a reference is usually made to the intervals of the thirds (major and minor) where the difference between the scales is much larger (14 and 16 cents respectively). You can listen to these scales and chords here, and judge for yourself, though the sound examples are synthesized and may lack the timbral richness of an acoustic instrument. Also, notice that with simultaneous pitch combinations, the chords, there will be audibly more beating in the thirds.
Without delving into the complexities of tuning in different cultures, as an ethnomusicologist does, consider this brief summary of some different traditions. In South Asian music built on traditional raga scales, the pitches of the raga are used as reference points (usually continuously sounded by a tambura instrument) around which a solo flute, voice or sitar will bend their melodic notes.
With Javanese music, the gamelan orchestra consists of many bronze cast instruments (as well as a few made of wood, drums, a bowed instrument, the rebab, and a bamboo flute, the suling). As in the Western carillon bell heard earlier, the timbre of the bronze instrument is metallic with enough partials present to add a specific pitch to each tone. As a result, the tuning of each metallic gamelan instrument cannot be identical, so aural judgements are used as to what sounds "correct".
Each gamelan orchestra will have its own unique tuning, even though the tuning typically follows a 5-note scale, slendro, and a 7-note scale, pelog. In the next module on timbre, we will consider the influence of the inharmonic spectra of these gamelan instruments on their tuning preferences (and hence why their music will sound different on traditional Western instruments that are largely based on harmonic spectra).
To complete this very brief survey of musical tuning systems, we will also reference the Pythagorean scale, which is solely based on the 3:2 ratio (the interval of the fifth) to arrive at all pitches in its scale, above and below the starting point. The odd consequence of this tuning is that a complete cycle of fifths doesn't exactly re-produce the octave. 7-note gamelan scale
From this brief and incomplete survey of a few well-known tuning systems, not to mention dozens of others that have been proposed, it can be seen that this field of study quickly becomes very complex, at least mathematically, and raises difficult issues in the relation of music to perception.
Index
Q. Try this review quiz to test your comprehension of the above material, and perhaps to clarify some distinctions you may have missed. Note that a few of the questions may have "best" and "second best" answers to explain these distinctions.
home