Social Vulnerability Analysis
Introduction
An operational definition for social vulnerability in this study will be the relative exposure of the population for a given risk factor as a percentage of the total population. The social vulnerability index will be constructed by taking the sum of each of these percentage points and dividing them by the total number of risk factors. The index does not consider post-tsunami vulnerabilities such as ability to recover or the need for more long-term sheltering as this is beyond the scope of the study. This method has been adapted based on a 2013 report by the USGS (United States Geological Survey 2013) which argues that inferring actual causal relationships between risk factors and tsunami mortality and injury would invite undue speculation. This method is descriptive and avoids misrepresenting vulnerability through unsubstantiated and unduly subjective factor weightings.
Data Overview
Data for the vulnerability index were sourced from 2006 Census data from Statistics Canada (Statistics Canada 2007) using all available dissemination areas for the Alberni-Clayoquot census division. Each dissemination area (DA) was checked for a corresponding DA polygon within the ArcGIS project and superfluous data was discarded so that each DA polygon had only one corresponding row of census data. Populations for each DA ranged between 400 and 600 with some outliers.
Data analysis happened within an Excel spreadsheet and the final vulnerability values were manually added to the ArcGIS project. Port Alberni has several Indian Reserves (IRs) that are not covered by the dataset available and have not been included in the analysis. The vulnerability index itself is calculated for each DA as follows:
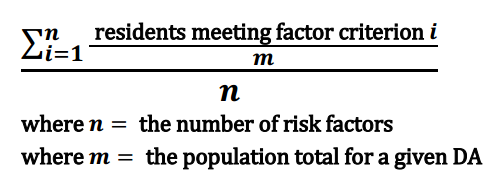
For example, if 30 out of 300 people of a DA meet a specified criterion, that factor for the DA will have a value of 10. For another criterion, if 3 people out of 300 match the criteria, that factor for the DA will have a value of 1. The sum of the percentage points (11) is divided by the total number of risk factors (2) and the DA would have a score of 5.5 or 0.055. This value is now normalised and can be compared against other DAs that have been calculated in the same way.
Risk Factors
- Age: The first age factor was calculated by summing Male 0-5, 5-9, and 10-14 totals with Female 0-5, 5-9, 10-15 totals, and dividing by the total population. The second age factor was done by summing Male and Female totals in 5-year increments from 50 and dividing by the total population.
- Income: Canada does not have an official definition of poverty and Statistics Canada does is not in a position to make such a political decision (Statistics Canada 2007). In lieu of such data, $12,000 in after-tax annual income is an estimate made to represent 'low income' individuals; however, such an assumption is recognised as entirely subjective. It is calculated as the sum of all individuals with or without declared income up to $11,999 and then divided by the total population. Households with more than one income could therefore have an income higher than $12,000 if there are multiple earners and still be classified as 'low income'.
- Single Female Parent: Children have already been accounted for above; therefore, the 'Total lone-parent families – female' attribute can be divided by the total population.
- Visible Minorities, Registered Indians, and Non-English Speakers: Speakers of non-English languages and total visible minorities each have their own totals. These are summed and divided by the total population. There is also an attribute for 'Registered Indians' which is divided against total population.
- Migrants: Migrants are defined as the average number of individuals that have moved into the area between 1 and 5 years ago, then divided by the total population.
- Rental and Band Housing, and Housing Quality: The sum of housing units identified as rental or band housing was summed and divided by the total number of occupied private dwellings. This does not take into account the number of residents within a dwelling. The attribute identifying occupied private dwellings requiring major repairs is used as a proxy for identifying DAs that may be structurally un-sound and at greater risk to earthquake and tsunami damage. This number is divided by the total number of occupied dwellings for which there is data on housing quality.
The final output map appeared as follows:
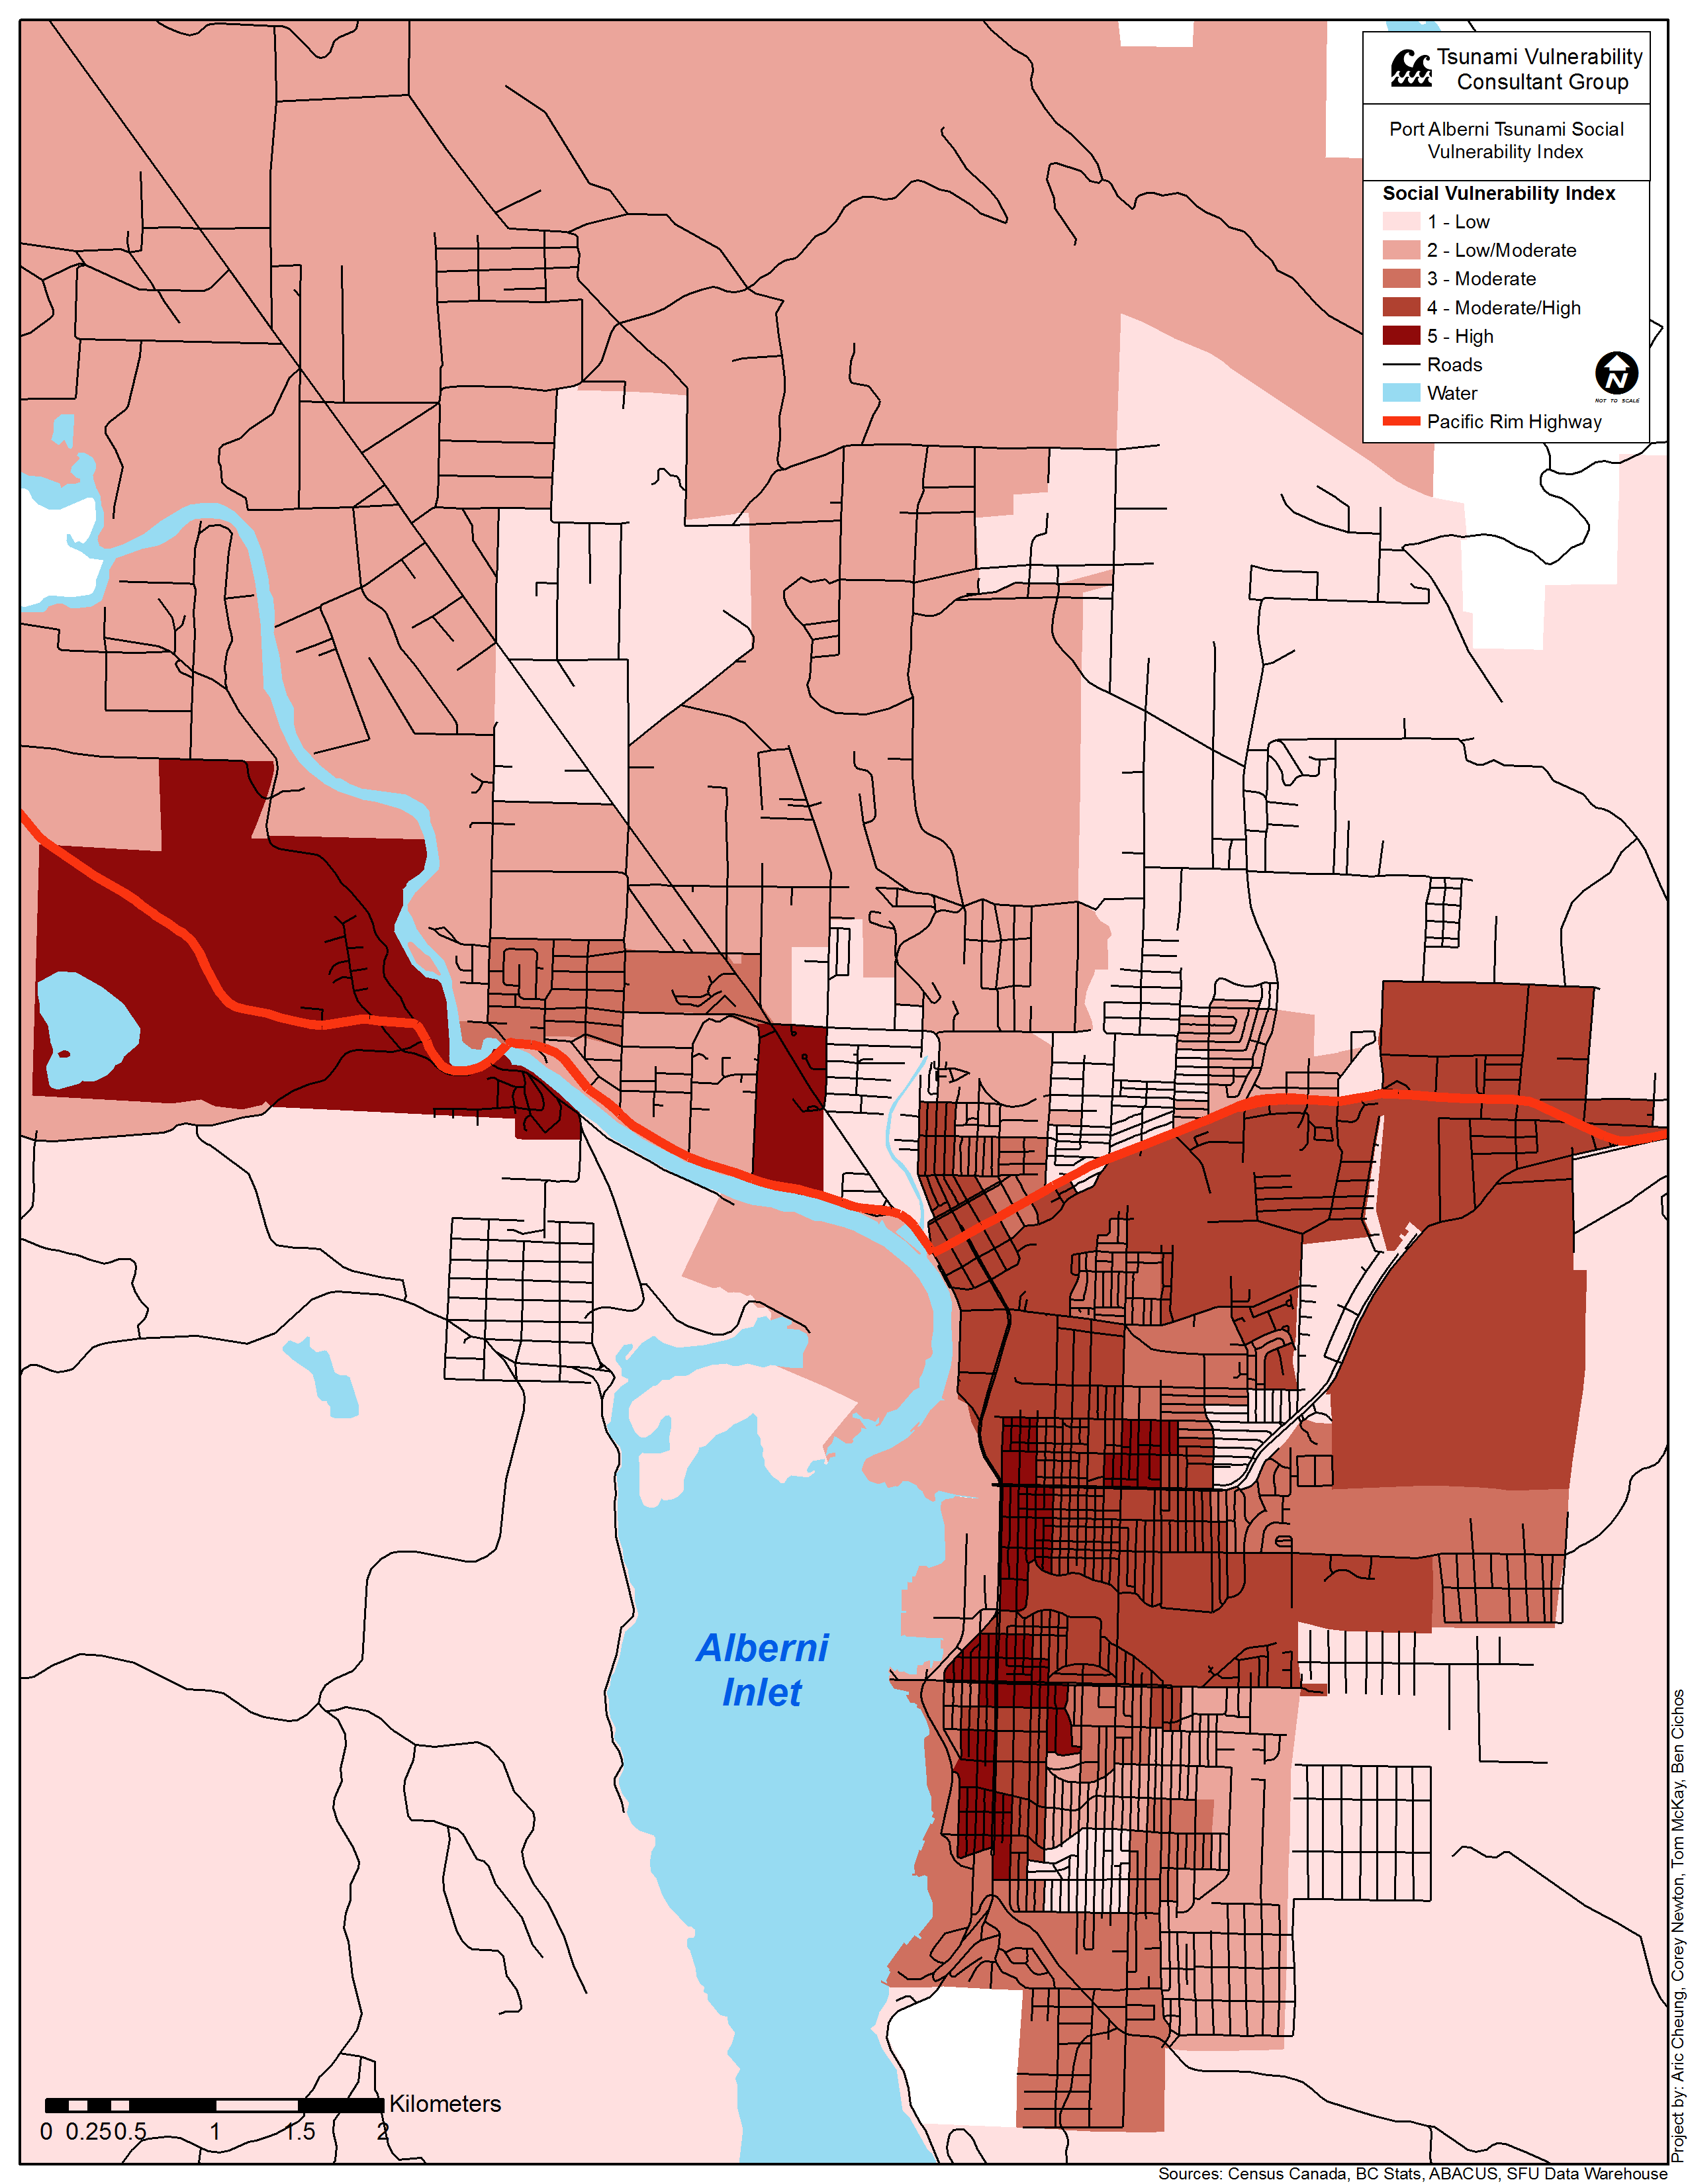
The social vulnerability map highlights areas near the east slopes along with high risk areas directly north of the inlet and along the Somas River. An Indian Reservation lies adjacent to the the high-risk DA in the north and erroneously has a 'low' vulnerability associated.