Topographic Analysis
Introduction
Topographic risk is an integral part to any vulnerability assessment regarding natural hazards and disasters. In particular, when conducting a vulnerability assessment for tsunamis, it is essential to determine the areas that would be more likely to be physically affected by incoming waves. For our assessment, the region of Port Alberni, Alberni Inlet, and Somas River were analysed using digital elevation models (DEMs) to classify four distinct sources of risk and combine them to create a final topographic vulnerability assessment map. These four factors are elevation, aspect, slope, and coastal proximity, and were decided upon from literature review of past tsunami risk assessments, with the most substantial influence coming from Sinaga's 2011 paper on tsunami vulnerability in Indonesia.
The data utilized to determine topographic vulnerability was collected from the Spatial Information Systems lab data warehouse at Simon Fraser University, and the ABACUS data sets through the British Columbia Research Libraries' Data Services. Lakes and rivers were found from the SFU warehouse, and the DEMs were found through ABACUS.
Reclassification of Features
Elevation was then reclassed from the final DEM raster based on values obtained from literature review with a macro-modeller to allow quick changes later on should the model require recalibration. This reclassification aimed to take the values of elevation and change them into five standardized categories of risk. The original elevation reclass was five categories of risk (5 being high, and 1 being low), each raising 5 meters from sea level, until the last included 20 meters and beyond. This was based on similar values within the Sinaga 2011 study. However, these were determined to be unsuitable since we wanted to portray a worst-case scenario and match historical indications of potential 20-meter inundation from almost 20-meter high tsunami waves. The reclassification was then altered to having 0-20 meters being the highest risk area and then decreased risk in increments of 5 meters from there. A similar process was carried out for Aspect and Slope once they were created using the Aspect and Slope Spatial Analyst Tools respectively using literature review as backup for the rationale behind the reclassifications.
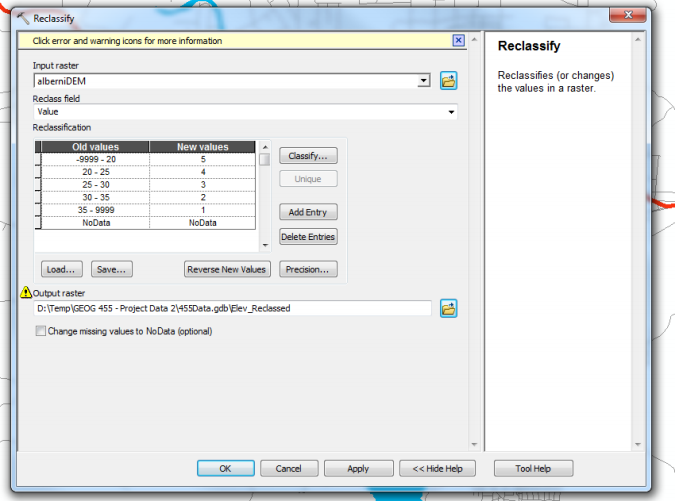
Reclassification of elevation into five categories of risk
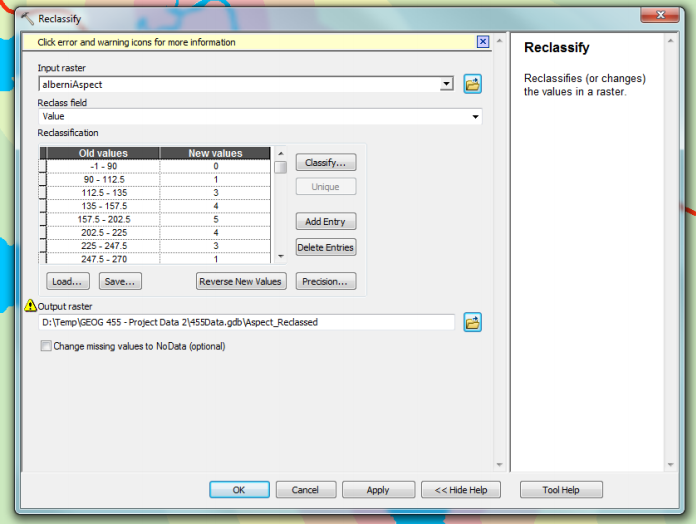
Reclassification of Aspect based on degree direction into five categories of risk. Slopes facing south recieved a higher score (more risk) than slopes facing north, east, or west.
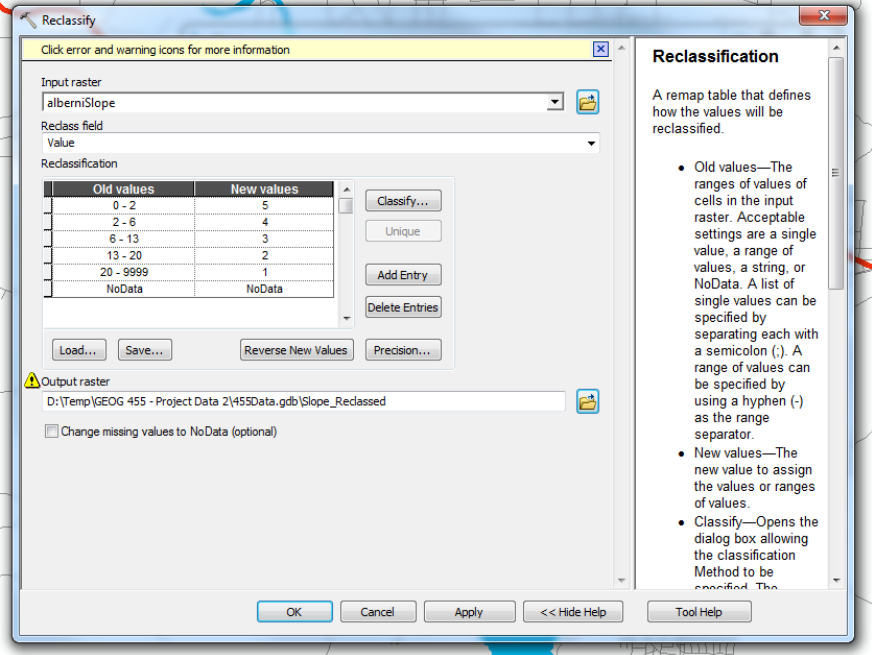
Reclassification of Slope into five categories of risk.
Coastal Proximity was also obtained by generating a buffer zone around the coastline and the Somas River. Various distances were separated into five levels of risk from the coastline.
Final weighting and Output
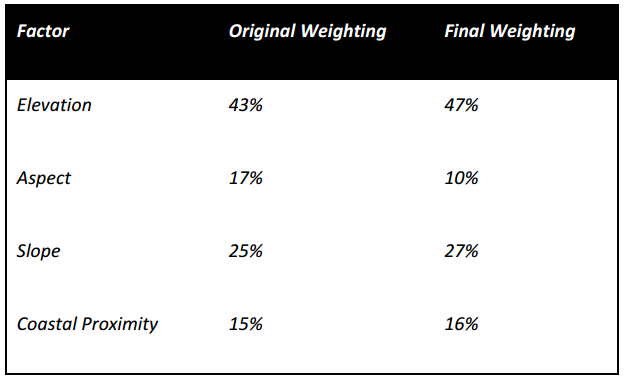
Finally, the four factors of Elevation, Aspect, Slope, and Coastal Proximity were combined using the Weighted Overlay tool in ArcMap that allows the user to assign specific weights to each factor, causing some factors to be favoured more than others do in the final analysis (Table). The weighted overlay was ran twice, since the first weightings resulted in a product which did not match historical inundations very well due to aspect being favoured too highly within the analysis. This was accounted for and fixed with the second weighted overlay.
The output map from these factors appeared as follows:
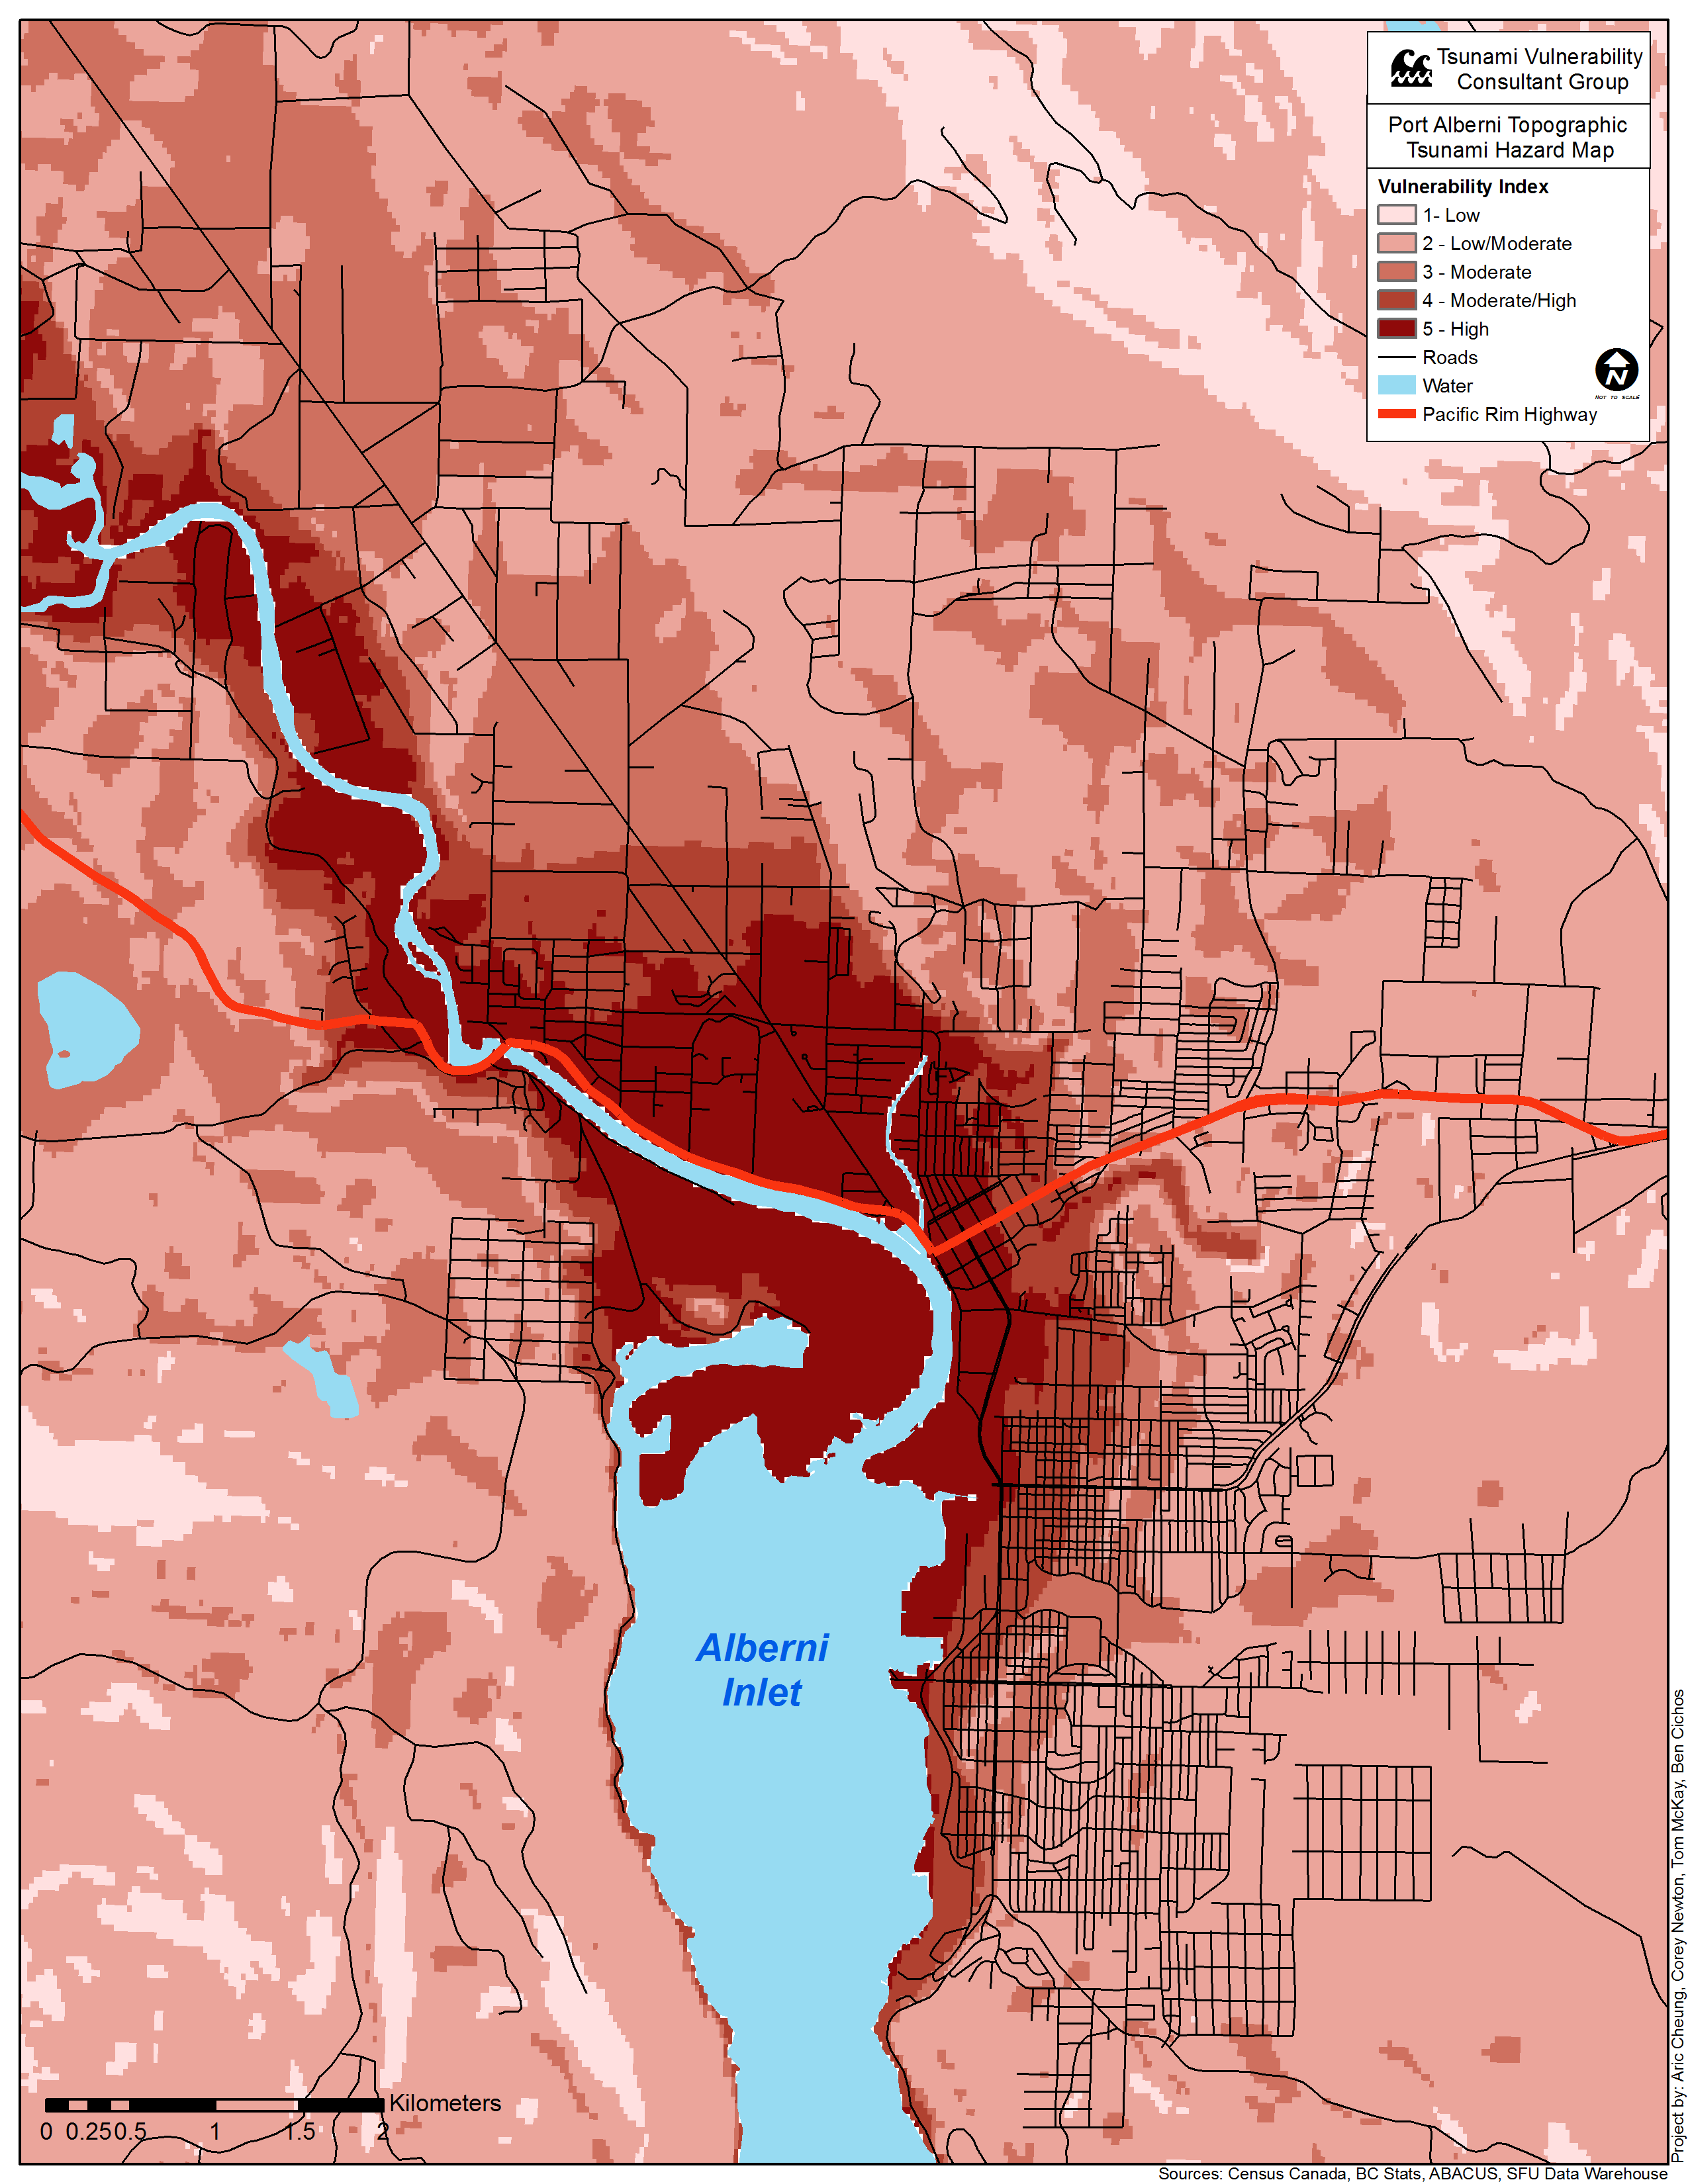
The Topographic map clearly shows a moderate hazard along the eastern slopes and the majoirt of the hazard is in the low lying area directly north of the inlet. This map also imporives upon existing sources by showing the hazard on the Somas and Stamp river systems further upstream.