Earthquake Early Warning Systems Modeling for North Vancouver
A Geography 355 Final Project by Tom McKay
Methodology
The first step was digitization and reclassification of data. The school location layer needed to be created manually using a postal code geocoder and NVSD school location data, and the Seismic update status of the schools needed to be attained from the most recent BC Ministry of Education Report Seismic Mitigation Program Progress Report.
All input datasets were then converted to an IDRISI friendly format and reclassified as follows:
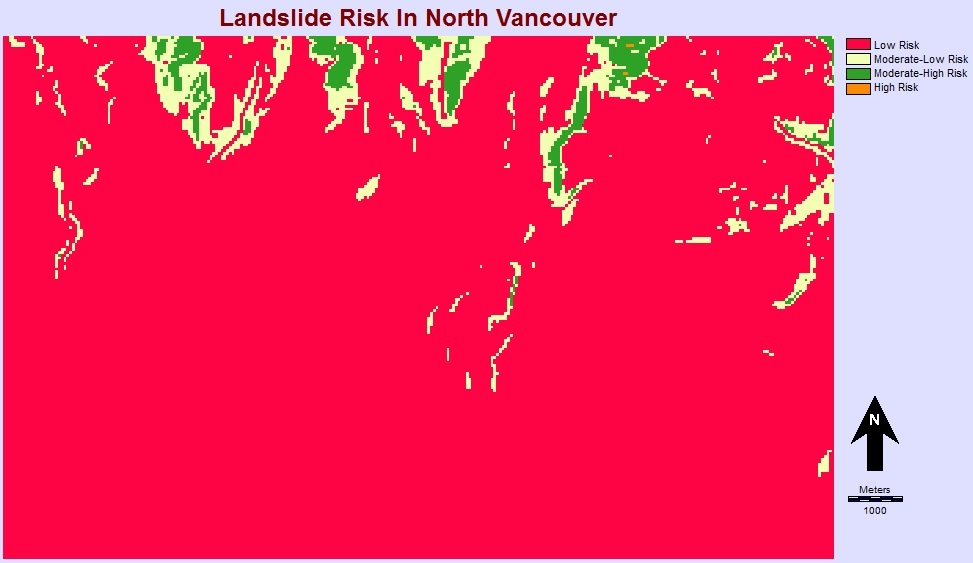
Slope Reclassification
Slope data for North Vancouver was reclassified to reflect the potential for landslides. Slopes between 0 and 25 degrees were classified as "Low Risk", slopes between 26 and 25 degrees were reclassified as "Moderate-Low Risk", slopes between 36 and 55 degreees were reclassified as "Moderate-High Risk", and slopes between 56 and 73 degrees were reclassified as "High Risk". The output map appeared as follows:
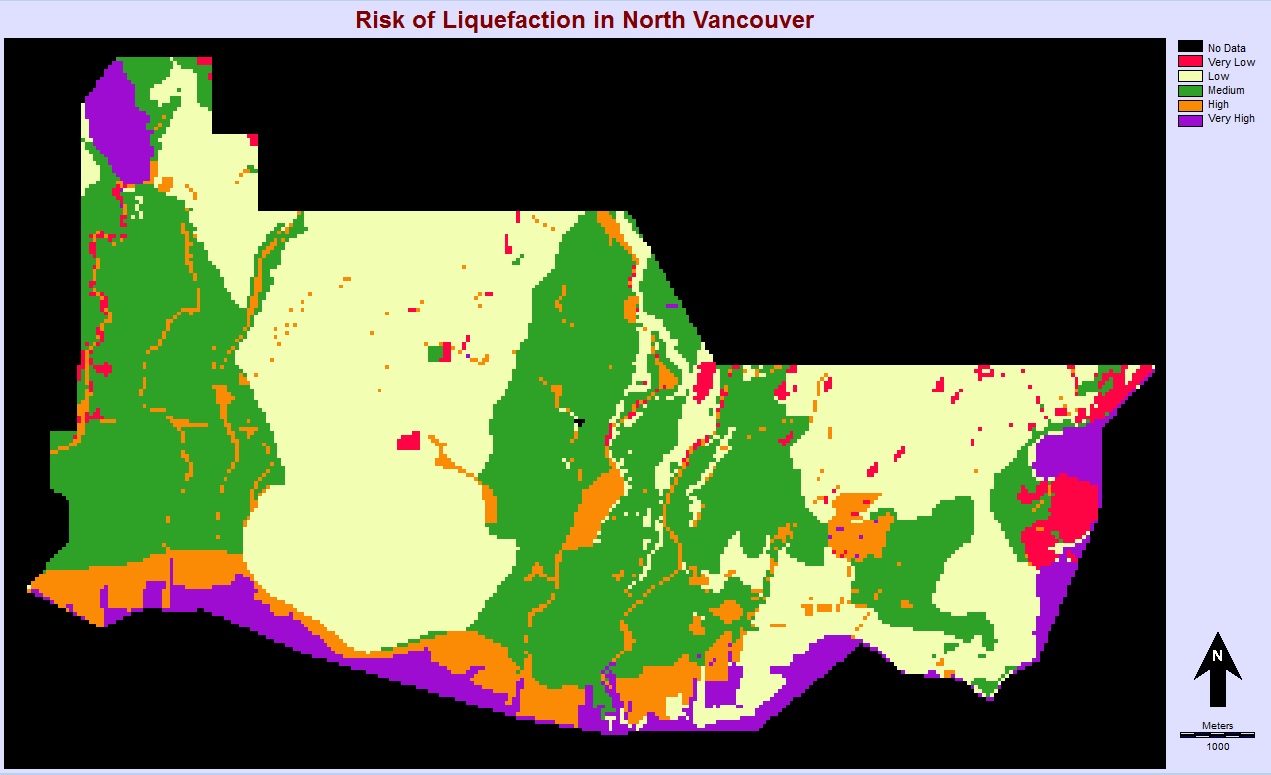
Surface Geology Reclassification
Surface Geology data for North Vancouver was reclassified to reflect risk of liquefaction based on the density of soil types. Soil types were homogenized into 5 groups based on their succeptibility to liquefaction: very low, low, medium, high, very high. For the purpose of modeling, areas of water were classified as "very high". The output map appeared as follows:
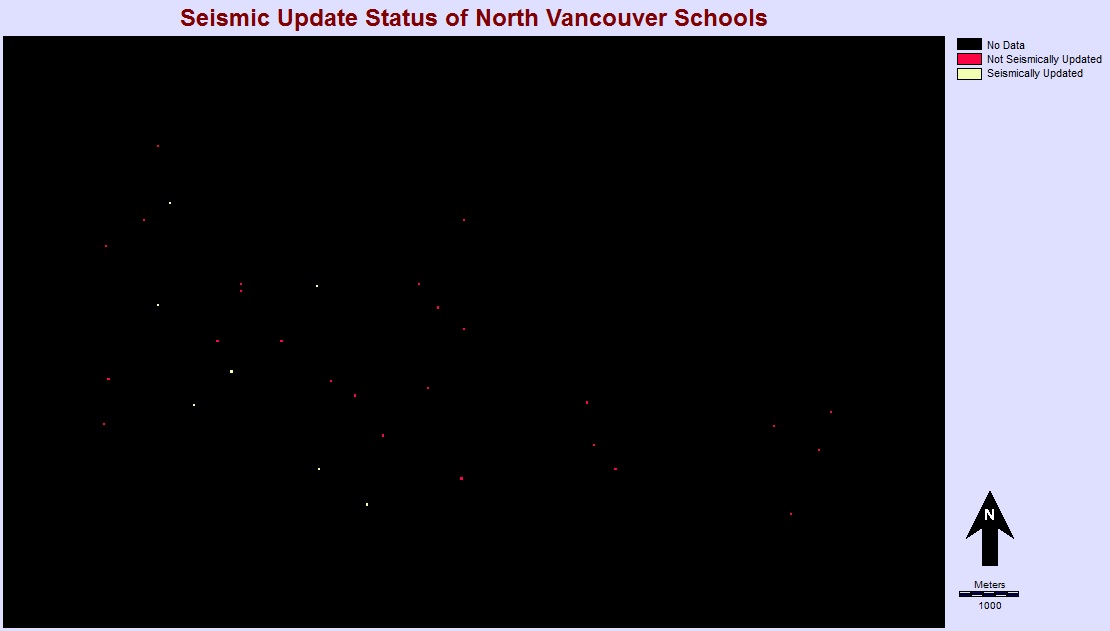
School Seismic Updates Reclassification
School point data was reclassified to provide values that reflect the seismic update status of the schools. Schools that have been seismically updated were reclassified as "Seismically Updated", and schools that were not were reclassified as "Not Seismically Updated." The output map appeared as follows:
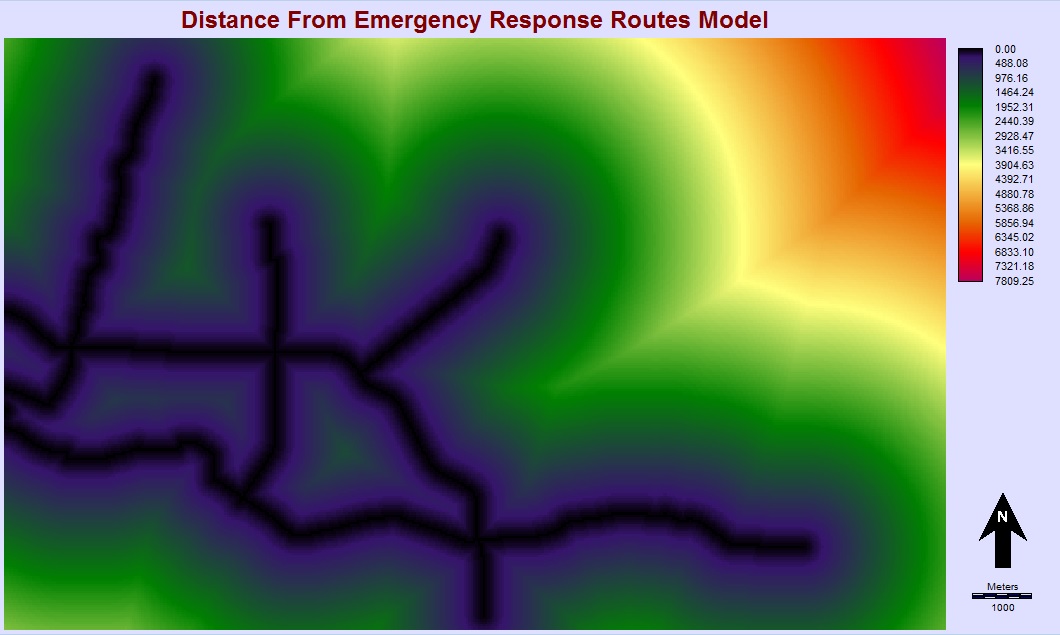
Disaster Response Routes Reclassification and Cost-Distance Modeling
Disaster response route data for North Vancouver was reclassified so data could be run through the "Distance" module, then the distance module was run to assign values to locations based on how far they are from disaster response routes. The output map appeared as follows:
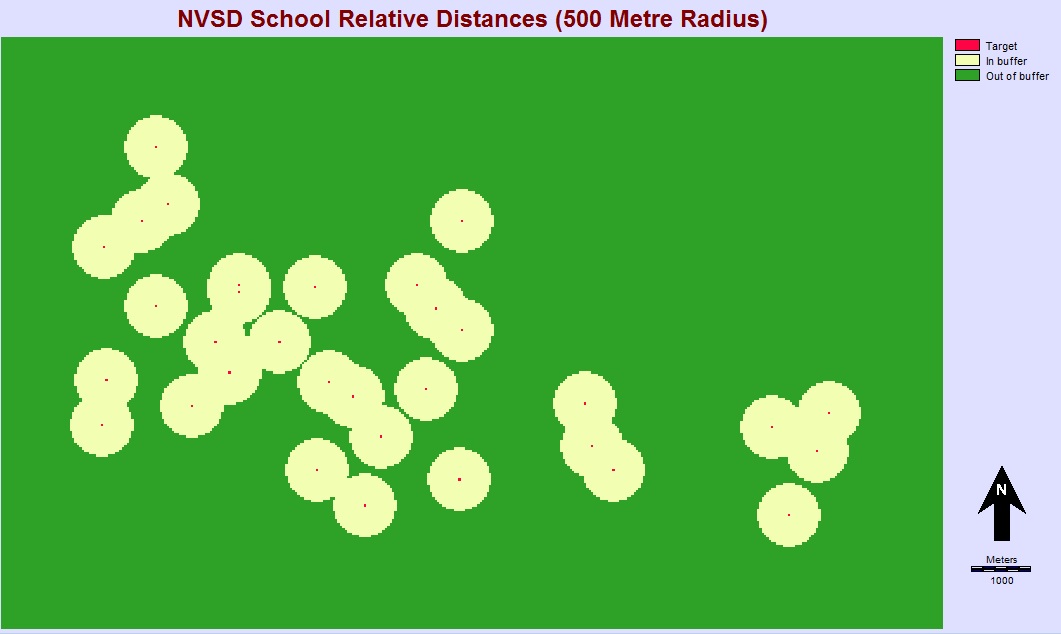
School Proximity Analysis
500 meter ring buffers were applied to schools to determine how far they were from each other. Schools furter than 500 meters from other campuses will be deemed as high priority targets for EEWS systems. The output map appeared as follows:
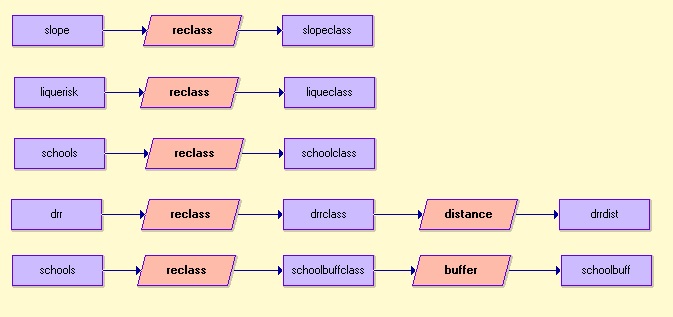
Final Reclassification Macro Model
The macro model is fairly simple as I did the majority of my data preparation and organization in ArcMap before pulling the data into IDRISI. Thanks to a introduction to the program through Geography 355 Lab work, I was aware of what kind of data works best within the confines of the program and the conversion went very smoothly.